



The Complete Excel Course with AI Integration
Excel course for SEO and PPC specialists
For SEO and PPC specialists who clean keyword lists, join tool exports and report campaigns in Excel. The Complete Excel Course with AI Integration has no search data of its own; this page picks out the lessons search work leans on: clean-up and text functions for keywords and URLs, conditional totals by theme, lookups to join exports, PivotTables for search term reports, dynamic lists, and the MarketPulse lessons for campaign ratios.
Taught by Sagnik Bhattacharya and Virginia Thorn

What you will be able to do
At work, you will be able to:
- Clean and deduplicate keyword lists with TRIM, LOWER, Find and Replace and Remove Duplicates.
- Group keywords and search terms into themes with SEARCH, IFERROR and IF, and total clicks, cost and conversions by theme with SUMIFS.
- Join rankings, traffic and conversions from different tools by URL or keyword with XLOOKUP, with IFERROR for a key one tool lacks.
- Summarise a search term report by theme, campaign or landing page with PivotTables and slicers.
- Build a redirect map from old addresses to new ones with text functions, XLOOKUP and CONCAT.
- Work out click-through rate, conversion rate and return on investment by campaign, and cost per click the same way, with IFERROR for rows with no clicks.
Projects
What you will build.
The course has 14 projects. These three matter most here.
-
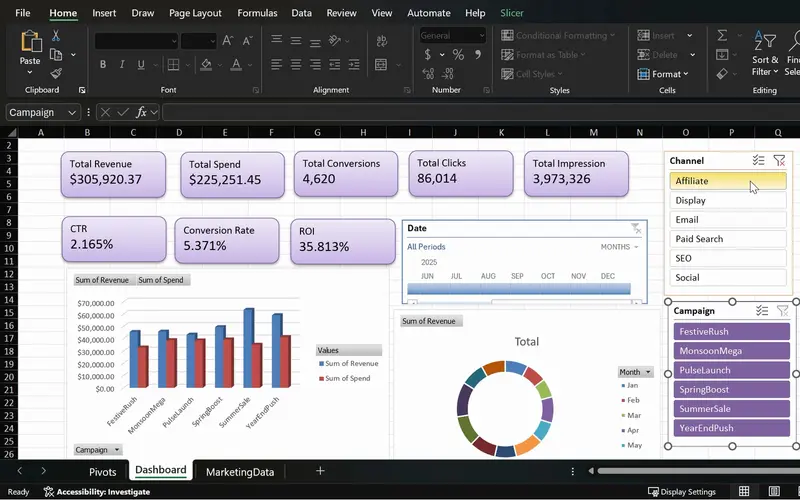
Project 08
MarketPulse
One screen that shows which campaigns earn back their spend.
Paid search campaigns judged on click-through rate, conversion rate and return, with a slicer for each campaign or channel.
-
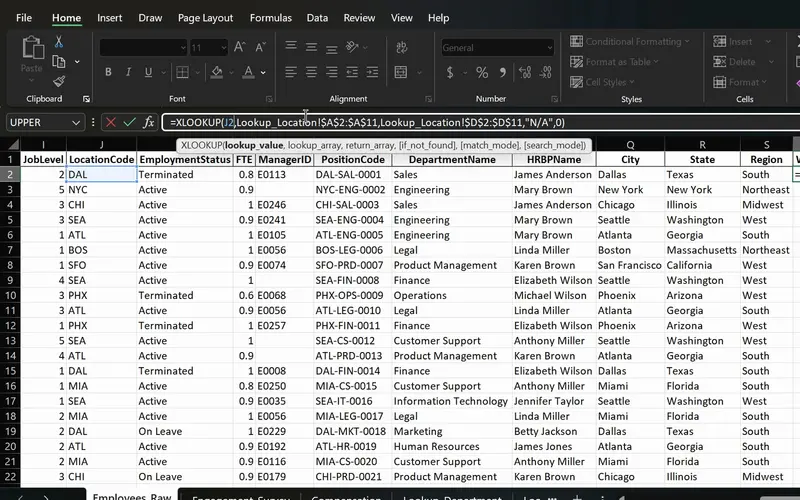
Project 06
PeopleInsight HR workbook
Employee data joined across sheets with one formula.
Lookups by URL or keyword instead of employee ID, and text formulas that take an address apart.
-
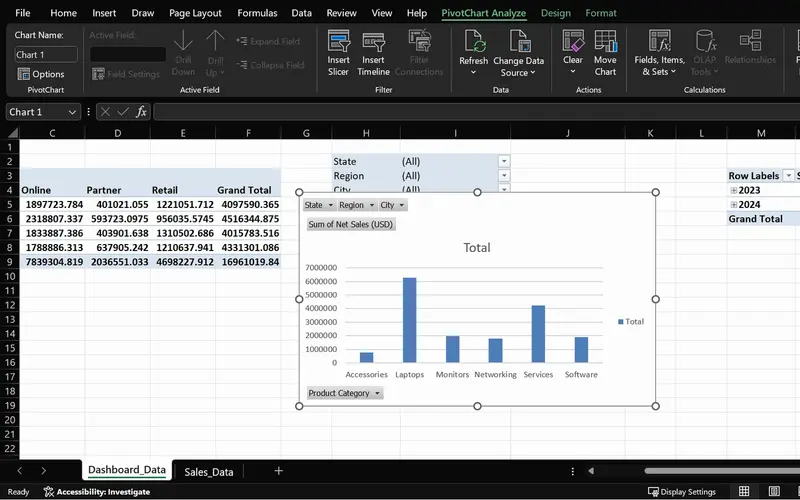
Project 05
SalesPlusPerformance
A sales question answered in seconds, straight from the order data.
A search term report summarised by theme and landing page, the way the course summarises orders, with slicers for each campaign.
Lessons
The lessons that matter, in course order.
The Complete Excel Course with AI Integration has 186 lessons. This page picks out 49 of them, 3 h 58 min of video. Each lesson keeps its number in the course.
Where to start
Lesson 22 Cleaning data in Excel
Begin at Lesson 22 if you can enter data and write a simple formula: keyword work starts with clean lists. New to Excel? Begin at Lesson 1. If text functions and SUMIFS are familiar, go to Lesson 67 to join exports with lookups, or to Lesson 105 for campaign ratios and the dashboard.
49 of 186 lessons · 3 h 58 min
03 Managing data in Excel: sort, filter and tables (Dunder Michael Paper employee database) Clean-up for exported lists: TRIM, Paste Special and Find and Replace, Remove Duplicates for a keyword or URL listed twice, and Flash Fill and Text to Columns to split a field. The lessons use an employee database.
- 22 Start here Cleaning data in Excel TRIM, Paste Special values and Find and Replace 13 min
- 23 Remove duplicates in Excel Find and delete duplicate rows in an employee list 6 min
- 24 Flash Fill in Excel Split first and last names automatically 3 min
- 25 Text to Columns in Excel Split data by delimiter into separate columns 6 min
04 Essential formulas and functions (IF, SUMIF and more) IF and IFS to label a theme or a keyword's status, AND and OR for two conditions, COUNTA for unique counts, and SUMIF, SUMIFS and COUNTIFS for clicks, cost and conversions by theme. The lessons use sales data.
- 29 The IF function in Excel Pass or fail results with a single condition 3 min
- 30 IF function practice in Excel Categorise sales data with IF formulas 6 min
- 31 Nested IF and IFS in Excel Customer value tiers with nested IF 6 min
- 32 Nested IF and IFS in Excel Sales performance labels with the IFS function 5 min
- 33 AND and OR with IF in Excel Flag high-value deals with multiple conditions 8 min
- 34 SUM, COUNT and COUNTA in Excel SUM with FILTER and counting numbers with COUNT 7 min
- 35 SUM, COUNT and COUNTA in Excel COUNTA, unique counts and completeness checks 4 min
- 36 SUMIF and COUNTIF in Excel Conditional sum and count with one criterion 8 min
- 37 SUMIFS and COUNTIFS in Excel Sum and count with multiple criteria 7 min
05 Text functions and data validation (enhancing data quality) Text functions for keywords and URLs: CONCAT and TEXTJOIN, TRIM, UPPER, LOWER and PROPER, FIND, SEARCH and SUBSTITUTE to find or replace a word, and Text to Columns to split an address at each slash.
- 41 CONCAT, the & operator and TEXTJOIN in Excel Combine text from multiple cells 6 min
- 42 TRIM, UPPER, LOWER and PROPER in Excel Clean messy text and fix capitalisation 6 min
- 43 FIND, SEARCH and SUBSTITUTE in Excel Locate and replace text with formulas 5 min
- 44 Text to Columns wizard in Excel Split a column by a comma delimiter 4 min
07 PivotTables and PivotCharts: data analysis made easy PivotTables over search term and keyword reports: clicks, cost and conversions by theme, campaign or landing page, slicers and PivotCharts. The lessons use sales orders.
- 57 PivotTables 101 in Excel What a PivotTable does and the sales dataset 5 min
- 58 Preparing data for PivotTables Clean data with TRIM, PROPER, find and replace 5 min
- 59 Create your first PivotTable in Excel Insert a PivotTable from a sales table 1 min
- 60 PivotTable fields in Excel Rows, values, columns and Value Field Settings 2 min
- 61 PivotTable summaries in Excel Sales by product category and grouping by date 4 min
- 62 Slicers in Excel Filter PivotTables with clickable buttons 3 min
- 63 PivotCharts in Excel Create interactive charts from a PivotTable 5 min
- 64 PivotTable design Tab Report layouts, PivotTable styles and number formats 5 min
- 65 Refresh a PivotTable in Excel Update pivots when source data changes 2 min
- 66 Excel Ninja Challenge PivotTable sales by region, category and monthly trend 1 min
08 Advanced Excel functions: lookups, text and arrays Lookups to join exports (XLOOKUP, VLOOKUP, INDEX and MATCH, IFERROR), LEFT, MID and RIGHT for the parts of a URL, then UNIQUE, FILTER and SORTBY for lists of themes, pages with no conversions or terms by cost. The lessons use HR data.
- 67 Lookup functions in Excel The PeopleInsight HR dataset and why lookups matter 2 min
- 68 VLOOKUP in Excel Find employee data across sheets with exact match 4 min
- 69 XLOOKUP in Excel Exact match, if not found and two-way lookup 6 min
- 70 IFERROR in Excel Handle lookup errors in VLOOKUP and XLOOKUP formulas 3 min
- 71 INDEX and MATCH in Excel A flexible alternative to VLOOKUP 6 min
- 72 CONCAT and TEXTJOIN in Excel Combine employee names and text with a delimiter 3 min
- 73 LEFT, RIGHT and MID in Excel Extract parts of a text code like DAL-SAL-0001 7 min
- 74 TODAY, EOMONTH and NETWORKDAYS in Excel Date calculations for HR data 5 min
- 75 UNIQUE function in Excel Extract a distinct list with dynamic arrays 6 min
- 76 FILTER function in Excel Dynamic array filtering with AND and OR criteria 5 min
- 77 SORT and SORTBY in Excel Sort data dynamically with formulas 4 min
- 78 Excel Ninja Challenge XLOOKUP, totals and text concatenation lookup challenge 3 min
11 MarketPulse campaign intelligence dashboard MarketPulse: campaign data cleaned, KPIs planned, click-through rate, conversion rate and return on investment with IFERROR, PivotTables, KPI cards, slicers and a timeline.
- 105 MarketPulse marketing dashboard in Excel Project overview and campaign data 4 min
- 106 Clean and check marketing data in Excel Remove duplicates, Copilot KPI plan 4 min
- 107 Plan a marketing dashboard with ChatGPT KPIs and the PivotTable strategy 4 min
- 108 Marketing PivotTables in Excel Build the MarketPulse pivot back end 6 min
- 109 CTR, conversion rate and ROI in Excel Marketing KPI formulas with IFERROR 4 min
- 110 PivotTables with Copilot Generate and verify marketing pivots in Excel 6 min
- 111 Marketing charts and a timeline in Excel MarketPulse dashboard PivotCharts 4 min
- 112 KPI cards in Excel Marketing KPI cards for the MarketPulse dashboard 7 min
- 113 Slicers for an Excel dashboard Interactive filtering in MarketPulse 4 min
- 114 Polish an Excel marketing dashboard Final formatting and insights in MarketPulse 9 min
Instructors
Who teaches it.

Instructor, Excel with AI
Virginia Thorn
Emmy Award winner. Teaches Excel with AI at Coding Liquids.
Questions
Asked before starting.
Which Excel course helps SEO and PPC specialists?
The Complete Excel Course with AI Integration from Coding Liquids teaches the spreadsheet work behind search marketing: keyword lists cleaned and deduplicated, keywords grouped into themes with SEARCH and IF, rankings, traffic and conversions joined by URL with XLOOKUP, search term reports summarised in PivotTables, redirect maps built with text functions, and click-through rate, conversion rate and return on investment with IFERROR. The 49 lessons here take 3 hours 58 minutes.
Can I group keywords into themes with Excel formulas?
Yes. With the text and logic lessons of The Complete Excel Course with AI Integration, LOWER and TRIM make the list consistent, SEARCH finds a theme word inside each keyword, IFERROR turns a miss into a blank, and IF or IFS writes the theme's name. SUMIFS then adds clicks, cost and conversions by theme, and a PivotTable sets the themes side by side.
How do I join data exported from different SEO and ad tools?
Make the keys match, then look up. The Complete Excel Course with AI Integration teaches TRIM and LOWER to tidy URLs and keywords, FIND with LEFT to cut an address before its tracking parameters, SUBSTITUTE to swap a part, and XLOOKUP or INDEX and MATCH to bring rankings, sessions or conversions onto one sheet, with IFERROR for a URL that another tool does not list.
Does the course teach Google Ads, Google Analytics or keyword tools?
No. The Complete Excel Course with AI Integration teaches Excel. SEO and advertising platforms, Google Analytics and keyword research tools are not taught. It starts once their reports are exported: cleaning keyword lists, grouping search terms, joining exports, building redirect maps and calculating campaign ratios.
Can I build a redirect map from old URLs to new ones?
Yes, with the text functions and lookups in The Complete Excel Course with AI Integration. Text to Columns or LEFT, MID and RIGHT split each address into its parts, SUBSTITUTE swaps an old folder name for a new one, XLOOKUP matches each old slug to its new page, IFERROR flags an old address with no match, and CONCAT writes the redirect line. Remove Duplicates catches an address listed twice.
Excel with AI
See the whole course.
The Complete Excel Course with AI Integration: 16 hours of video in 186 lessons, built around 14 projects, with lifetime access, a Certificate of Completion and a 14-day money-back guarantee.
The same course
For another job, level or topic.
By job
Finance and accounting
- Accountants and finance teams
- Bookkeepers and accounts assistants
- FP&A and budget analysts
- Auditors and fraud examiners
- Payroll administrators
- Tax accountants and advisers
- Banking professionals
- Cost and management accountants
- Financial controllers
- Credit control and receivables teams
- Accounts payable teams
- Financial planners and advisers
- Credit analysts and loan officers
- Insurance underwriters
- Insurance claims handlers
- Reconciliation analysts
- Treasury analysts
- Medical billing and coding specialists
- Fund accountants
- Billing administrators
- AML and KYC analysts
- Actuarial analysts
- Insurance agents and brokers
HR and office administration
Operations and supply chain
- Operations and project managers
- Procurement and purchasing officers
- Logistics coordinators
- Inventory controllers and storekeepers
- Supply chain analysts
- Warehouse managers and supervisors
- PMO analysts
- Import and export coordinators
- Production planners
- Demand planners
- Fleet and transport managers
- Apparel merchandisers
Data and reporting
Sales, marketing and customer service
Business and management
Engineering, construction and manufacturing
- Quantity surveyors and estimators
- Civil and site engineers
- Quality managers and engineers
- Construction project managers
- Health and safety officers
- Document controllers
- Production managers and supervisors
- Mechanical and electrical engineers
- Industrial engineers
- Planning engineers
- Sustainability and ESG analysts
- Maintenance planners