



The Complete Excel Course with AI Integration
Excel course for financial planners
For financial planners, advisers and paraplanners who model clients' savings, investments and retirement in Excel. This page picks out the parts of The Complete Excel Course with AI Integration that planning work uses: the WealthFlow investment and retirement simulator, the personal budget tracker it builds on, IF logic for rules tied to age, charts that explain a plan, and AI lessons with a checklist for what the AI returns.
Taught by Sagnik Bhattacharya and Virginia Thorn

What you will be able to do
At work, you will be able to:
- Project what a client's monthly investment grows to with FV, including a plan that steps up each year.
- Show the effect of inflation by turning future values into today's money and planning withdrawals on a real rate of return.
- Plan withdrawals in retirement and test how long the money lasts when returns come in lower.
- Set out a client's income and spending with totals, averages, a summary by category and warnings in colour.
- Explain a plan with charts a client can read: a line for growth, a combo chart on two axes and sparklines beside the figures.
- Use ChatGPT or Claude to plan and build a workbook, and check each figure the AI returns before a client sees it.
Projects
What you will build.
The course has 14 projects. These four matter most here.
-
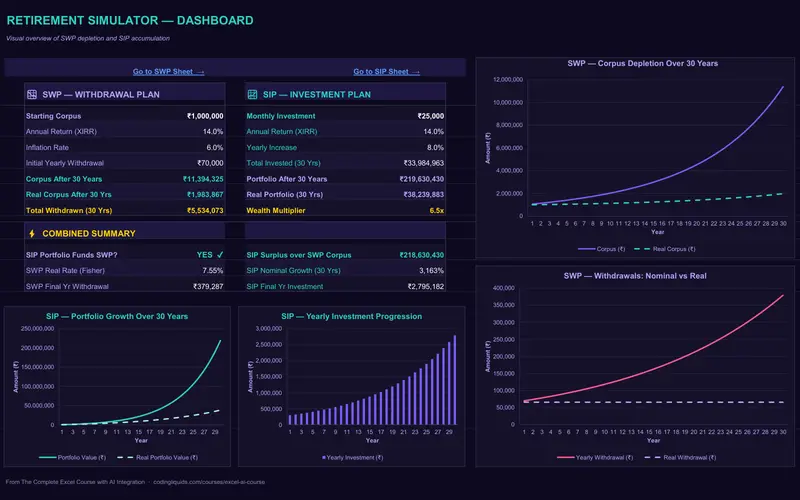
Project 10
WealthFlow
A retirement plan that shows how long the money lasts.
A client meeting's questions answered in one workbook: what a monthly plan with yearly step-ups grows to, its worth after inflation, how much can be withdrawn, and what happens if returns disappoint.
-
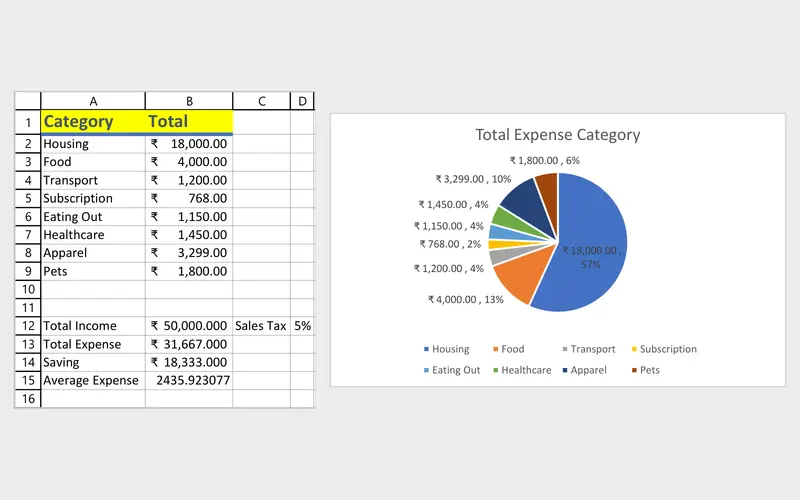
Project 01
Personal Budget Tracker
Your first workbook: where the money goes each month.
Where a plan begins: income and spending set out with totals and averages, warnings in colour, a summary by category and a calculator for a monthly investment.
-
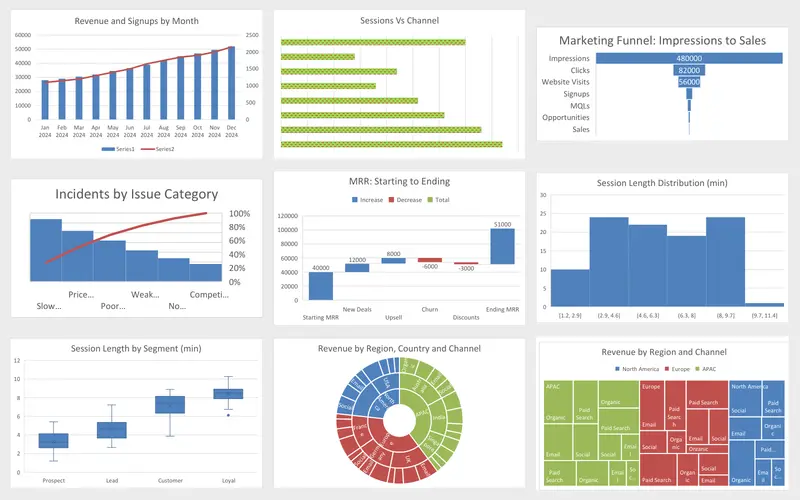
Project 04
Marketing Engagement Dashboard
Nine charts, each picked for the question it answers.
Charts a client can read at a glance, practised on marketing data: a line for growth over the years, a combo on two axes, and a waterfall from contributions to the final value.
-
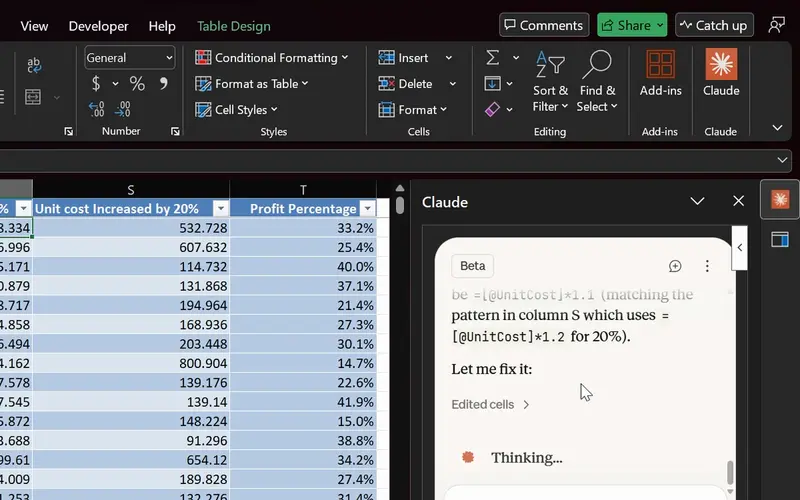
Project 14
Agentic AI in Excel
AI finds and fixes the formula; you check it before it counts.
Claude and ChatGPT as planning helpers: an analysis planned before it is built, a workbook analysed with Claude, and a QA checklist run on whatever the AI returns.
Lessons
The lessons that matter, in course order.
The Complete Excel Course with AI Integration has 186 lessons. This page picks out 34 of them, 2 h 54 min of video. Each lesson keeps its number in the course.
Where to start
Lesson 14 SUM and AVERAGE in Excel
Begin at Lesson 14 if you can enter data and write a simple formula: a client's budget comes before the plan. New to Excel? Begin at Lesson 1. If formulas and charts are familiar, go straight to Lesson 125, where WealthFlow begins.
34 of 186 lessons · 2 h 54 min
02 Project: personal budget tracker The personal budget tracker: totals and averages, conditional formatting for warnings, a monthly summary by category, a pie chart of spending and an FV calculator for a monthly investment. A client's cash flow is set out the same way.
- 14 Start here SUM and AVERAGE in Excel Personal budget tracker totals and average expense 4 min
- 15 Conditional formatting in Excel Highlight rules, data bars and icon sets 3 min
- 16 Monthly expense summary in Excel Category totals for a personal budget tracker 7 min
- 17 Excel charts for beginners Pie chart of budget expenses by category 8 min
- 18 SIP growth calculator in Excel FV function for mutual fund investment growth 7 min
04 Essential formulas and functions (IF, SUMIF and more) TRUE and FALSE tests and the IF function, the logic the retirement simulator later uses to stop contributions at a set age.
- 28 Logical functions in Excel TRUE and FALSE comparisons for beginners 5 min
- 29 The IF function in Excel Pass or fail results with a single condition 3 min
- 30 IF function practice in Excel Categorise sales data with IF formulas 6 min
06 Data visualisation: charts and graphs Charts for explaining a plan: choosing the chart for the question, column, line and combo charts, formatting that makes them readable, sparklines, and the waterfall chart. The lessons chart marketing data.
- 48 Choosing the right Excel chart Column, line, pie, combo and modern chart types 4 min
- 49 Column charts in Excel Insert, format and label a column chart 5 min
- 50 Line charts in Excel Show trends over time with a line chart 4 min
- 51 Pie charts in Excel Show proportions and parts of a whole 4 min
- 52 Combo charts in Excel Column and line chart with a secondary axis 4 min
- 53 Formatting charts in Excel Titles, data labels, colours and chart styles 7 min
- 54 Sparklines in Excel Line, column and win-loss mini charts in cells 5 min
- 55 Funnel, Pareto and waterfall charts in Excel Modern charts for business data 5 min
- 56 Histogram, box and whisker, treemap and sunburst Advanced Excel chart types 6 min
10 Boosting productivity with AI in Excel (Copilot, ChatGPT and Claude) AI with checks: a QA checklist for AI output, ChatGPT as an analysis planner, the COPILOT function in cells, Copilot guided help, Microsoft Stride building a workbook, and Claude analysing data and building spreadsheets.
- 99 Check AI output in Excel A quick QA checklist for Copilot results 2 min
- 100 ChatGPT as your analysis planner Plan an Excel analysis before you build it 3 min
- 101 COPILOT function in Excel Use Copilot as a formula inside your cells 4 min
- 102 Copilot guided help in Excel Step-by-step AI help inside Excel 3 min
- 103 Microsoft Stride for Excel The Office Agent that builds workbooks for you 4 min
- 104 Claude in Excel Analyse data and build spreadsheets with Claude 7 min
13 WealthFlow investment and retirement simulator WealthFlow, the centre of this path: SIP and SWP explained, a step-up SIP table with FV, real values after inflation, withdrawals from a corpus with a stress test, and a lifetime retirement simulator with year and age columns, read through scenarios and turned into a dashboard with Claude.
- 125 SIP and SWP calculators What is an SIP, lump sum and compounding 6 min
- 126 SIP and SWP calculators What is an SWP, inflation and FIRE 6 min
- 127 WealthFlow SIP model in Excel Input assumptions, XIRR and monthly rate 6 min
- 128 WealthFlow SIP model in Excel Step-up SIP table and FV formulas 6 min
- 129 WealthFlow SIP model in Excel Real portfolio value, inflation and charts 7 min
- 130 WealthFlow SWP model in Excel Real rate, corpus and yearly withdrawals 6 min
- 131 WealthFlow SWP model in Excel Real corpus, stress test and SWP chart 5 min
- 132 Retirement simulator in Excel WealthFlow inputs, year and age columns 5 min
- 133 Retirement simulator in Excel SIP, withdrawal and portfolio formulas with IF 7 min
- 134 Retirement simulator in Excel Reading the results and retirement scenarios 5 min
- 135 Retirement simulator in Excel Claude builds the WealthFlow dashboard 5 min
Instructors
Who teaches it.

Instructor, Excel with AI
Virginia Thorn
Emmy Award winner. Teaches Excel with AI at Coding Liquids.
Questions
Asked before starting.
Is there an Excel course for financial planners?
Yes. The Complete Excel Course with AI Integration from Coding Liquids has a project built around planning work: WealthFlow, which models monthly investing with yearly step-ups, inflation, withdrawals in retirement and a lifetime simulator with FV, XIRR and IF. This page adds the budget tracker, the charts for explaining a plan and the AI lessons: 34 lessons in all, 2 hours 54 minutes of the course's 16 hours.
Does the course cover financial advice rules or tax planning?
No. The Complete Excel Course with AI Integration teaches Excel, not financial planning: advice regulation, tax planning, insurance needs analysis and portfolio optimisation are not covered. WealthFlow is a calculation model for one person's investing and withdrawals; how you use it with clients follows your own rules and qualifications.
Can I build a retirement calculator in Excel?
Yes. In The Complete Excel Course with AI Integration WealthFlow builds one in steps: a SIP model with a step-up table and FV, an SWP model that draws from a corpus and is stress-tested, then a lifetime simulator with year and age columns where IF stops contributions once withdrawals begin. In the last lesson Claude builds a dashboard on the results.
Can AI help me prepare client plans in Excel?
It can help you build and check them. The Complete Excel Course with AI Integration shows ChatGPT planning an analysis before you build it, Claude analysing data and building spreadsheets inside Excel, the COPILOT function in a cell, and a QA checklist for anything the AI returns. The advice itself stays with you.
Excel with AI
See the whole course.
The Complete Excel Course with AI Integration: 16 hours of video in 186 lessons, built around 14 projects, with lifetime access, a Certificate of Completion and a 14-day money-back guarantee.
The same course
For another job, level or topic.
By job
Finance and accounting
- Accountants and finance teams
- Bookkeepers and accounts assistants
- FP&A and budget analysts
- Auditors and fraud examiners
- Payroll administrators
- Tax accountants and advisers
- Banking professionals
- Cost and management accountants
- Financial controllers
- Credit control and receivables teams
- Accounts payable teams
- Credit analysts and loan officers
- Insurance underwriters
- Insurance claims handlers
- Reconciliation analysts
- Treasury analysts
- Medical billing and coding specialists
- Fund accountants
- Billing administrators
- AML and KYC analysts
- Actuarial analysts
- Insurance agents and brokers
HR and office administration
Operations and supply chain
- Operations and project managers
- Procurement and purchasing officers
- Logistics coordinators
- Inventory controllers and storekeepers
- Supply chain analysts
- Warehouse managers and supervisors
- PMO analysts
- Import and export coordinators
- Production planners
- Demand planners
- Fleet and transport managers
- Apparel merchandisers
Data and reporting
Sales, marketing and customer service
Business and management
Engineering, construction and manufacturing
- Quantity surveyors and estimators
- Civil and site engineers
- Quality managers and engineers
- Construction project managers
- Health and safety officers
- Document controllers
- Production managers and supervisors
- Mechanical and electrical engineers
- Industrial engineers
- Planning engineers
- Sustainability and ESG analysts
- Maintenance planners