



The Complete Excel Course with AI Integration
Excel course for compensation and benefits analysts
For compensation, benefits and reward analysts managing salary bands, merit increases, bonus payouts and annual reviews, this guide highlights the modules in The Complete Excel Course with AI Integration that apply to reward analytics. It covers lookups for pay scales and merit matrices, IF and IFS logic for bonus tiers, PivotTables for grade or department summaries, distribution charts, and the FinanceGuard model for review costs against budgets.
Taught by Sagnik Bhattacharya and Virginia Thorn

What you will be able to do
At work, you will be able to:
- Retrieve salary band boundaries (minimum, midpoint and maximum) for each grade using XLOOKUP to calculate position in range and compa-ratio values.
- Locate percentage increases within a merit matrix using two-way XLOOKUP lookups that cross-reference position in range with performance ratings.
- Define bonus calculation rules based on performance targets using IF, IFS, AND and OR, then aggregate payout totals across departments or teams with SUMIFS.
- Analyse compensation across departments, grades and genders using PivotTables with slicers, and display salary dispersion inside grades using box and whisker charts.
- Model the yearly pay review against allocated funds with a budget versus actual framework, calculating variance and percent variance alongside KPI cards.
Projects
What you will build.
The course has 14 projects. These four matter most here.
-
Project 06
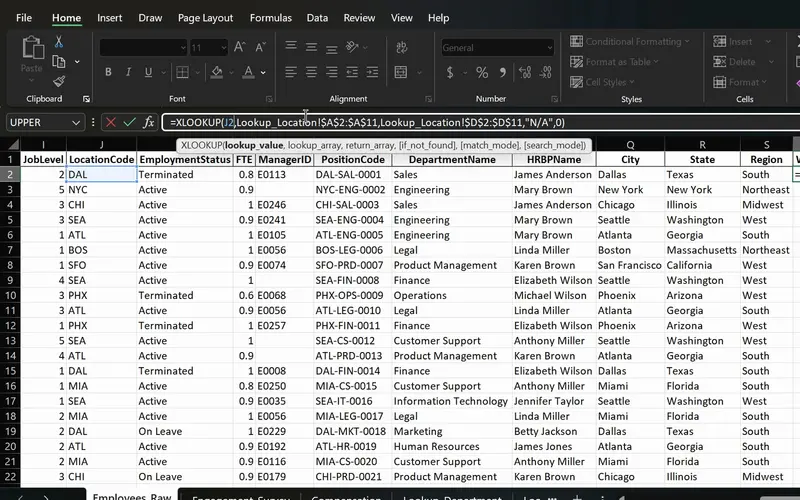
PeopleInsight HR workbook
Employee data joined across sheets with one formula.
Work with the lookup functions that reward analytics relies on, explored across employee records: XLOOKUP for salary bands, two-way lookups for merit matrices, and IFERROR when a job title has no survey match.
-
Project 05
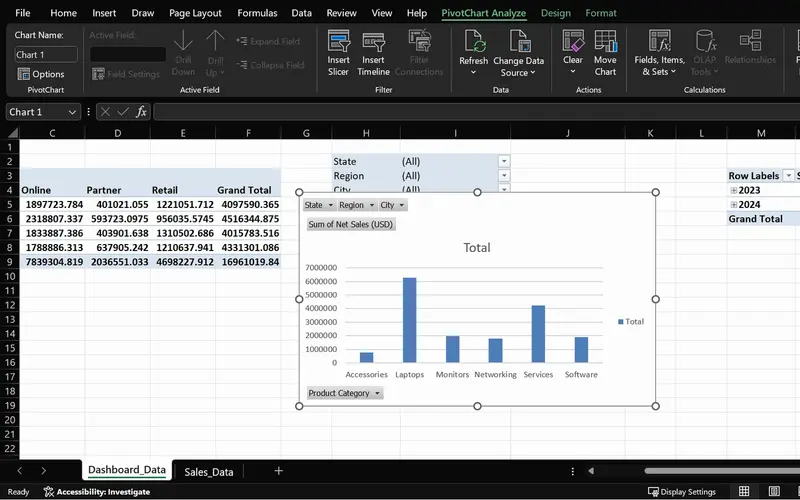
SalesPlusPerformance
A sales question answered in seconds, straight from the order data.
Group and filter compensation records across gender, department or grade swiftly, mirroring the way order datasets are sliced by region and category.
-
Project 09
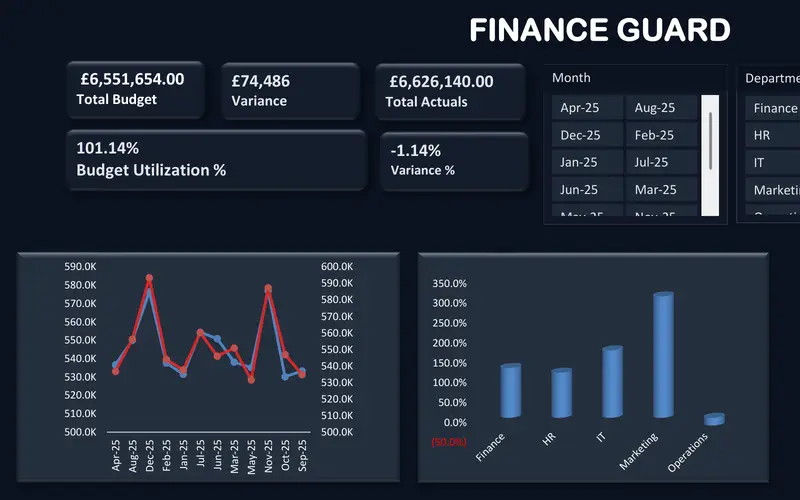
FinanceGuard
The budget vs actual report finance teams send every month.
Structure the annual pay review alongside its budget, comparing projected and actual numbers, highlighting variance and percentage variance with colour, and filtering segments with slicers.
-
Project 03
Sales Goal Tracker
Apply IF and IFS conditional formulas to evaluate performance against targets, translating the mechanics of bonus tiers to commercial figures.
Lessons
The lessons that matter, in course order.
The Complete Excel Course with AI Integration has 186 lessons. This page picks out 47 of them, 3 h 47 min of video. Each lesson keeps its number in the course.
Where to start
Lesson 28 Logical functions in Excel
Start with Lesson 28 if you are comfortable inputting data and constructing basic formulas, as bonus rules begin with IF statements. Those entirely new to the software should start at Lesson 1, where absolute cell references and percentage calculations are introduced early. If formulas like IF and SUMIFS as well as PivotTables are already familiar, jump ahead to Lesson 67 to focus on the lookup techniques used for salary bands and merit grids.
47 of 186 lessons · 3 h 47 min
04 Essential formulas and functions (IF, SUMIF and more) Incentive plan logic: determine bonus tiers from target results with IF and IFS, incorporate dual criteria via AND and OR, sum salaries and count staff across grades using SUMIFS and COUNTIFS, and manage dates. The lessons apply these rules to sales figures, but bonus models use the same logic.
- 28 Start here Logical functions in Excel TRUE and FALSE comparisons for beginners 5 min
- 29 The IF function in Excel Pass or fail results with a single condition 3 min
- 30 IF function practice in Excel Categorise sales data with IF formulas 6 min
- 31 Nested IF and IFS in Excel Customer value tiers with nested IF 6 min
- 32 Nested IF and IFS in Excel Sales performance labels with the IFS function 5 min
- 33 AND and OR with IF in Excel Flag high-value deals with multiple conditions 8 min
- 34 SUM, COUNT and COUNTA in Excel SUM with FILTER and counting numbers with COUNT 7 min
- 35 SUM, COUNT and COUNTA in Excel COUNTA, unique counts and completeness checks 4 min
- 36 SUMIF and COUNTIF in Excel Conditional sum and count with one criterion 8 min
- 37 SUMIFS and COUNTIFS in Excel Sum and count with multiple criteria 7 min
- 38 The Excel function library Insert Function dialog and Formula AutoComplete 5 min
- 39 Date and time functions in Excel TODAY, NOW, MONTH and date arithmetic 6 min
- 40 Excel Ninja Challenge COUNTIF, SUMIF, IF, COUNTIFS, SUMIFS and IFS practice 8 min
06 Data visualisation: charts and graphs Visual displays for salary reviews: build a waterfall chart to track changes from the previous year's total wage bill to the current one, and use histograms or box and whisker charts to examine salary distribution inside each grade. The demonstrations construct these on commercial datasets.
- 55 Funnel, Pareto and waterfall charts in Excel Modern charts for business data 5 min
- 56 Histogram, box and whisker, treemap and sunburst Advanced Excel chart types 6 min
07 PivotTables and PivotCharts: data analysis made easy Interactive summaries using PivotTables, slicers and PivotCharts to break down compensation across department, grade or gender, establishing the initial figures for pay gap reviews. Although taught with sales transactions, employee salary lists follow the same approach.
- 57 PivotTables 101 in Excel What a PivotTable does and the sales dataset 5 min
- 58 Preparing data for PivotTables Clean data with TRIM, PROPER, find and replace 5 min
- 59 Create your first PivotTable in Excel Insert a PivotTable from a sales table 1 min
- 60 PivotTable fields in Excel Rows, values, columns and Value Field Settings 2 min
- 61 PivotTable summaries in Excel Sales by product category and grouping by date 4 min
- 62 Slicers in Excel Filter PivotTables with clickable buttons 3 min
- 63 PivotCharts in Excel Create interactive charts from a PivotTable 5 min
- 64 PivotTable design Tab Report layouts, PivotTable styles and number formats 5 min
- 65 Refresh a PivotTable in Excel Update pivots when source data changes 2 min
- 66 Excel Ninja Challenge PivotTable sales by region, category and monthly trend 1 min
08 Advanced Excel functions: lookups, text and arrays Lookup methods built on the PeopleInsight HR dataset: deploy VLOOKUP, XLOOKUP alongside two-way lookups, INDEX and MATCH, IFERROR when a job title has no match, EOMONTH and NETWORKDAYS for calendar calculations, and UNIQUE, FILTER and SORT to compile role and grade listings.
- 67 Lookup functions in Excel The PeopleInsight HR dataset and why lookups matter 2 min
- 68 VLOOKUP in Excel Find employee data across sheets with exact match 4 min
- 69 XLOOKUP in Excel Exact match, if not found and two-way lookup 6 min
- 70 IFERROR in Excel Handle lookup errors in VLOOKUP and XLOOKUP formulas 3 min
- 71 INDEX and MATCH in Excel A flexible alternative to VLOOKUP 6 min
- 72 CONCAT and TEXTJOIN in Excel Combine employee names and text with a delimiter 3 min
- 73 LEFT, RIGHT and MID in Excel Extract parts of a text code like DAL-SAL-0001 7 min
- 74 TODAY, EOMONTH and NETWORKDAYS in Excel Date calculations for HR data 5 min
- 75 UNIQUE function in Excel Extract a distinct list with dynamic arrays 6 min
- 76 FILTER function in Excel Dynamic array filtering with AND and OR criteria 5 min
- 77 SORT and SORTBY in Excel Sort data dynamically with formulas 4 min
- 78 Excel Ninja Challenge XLOOKUP, totals and text concatenation lookup challenge 3 min
12 Project: FinanceGuard budget variance analyser (budget vs actual Excel dashboard) The FinanceGuard budget versus actual model: organise budget and actual tables, combine SUMIFS with UNIQUE, VSTACK and LET, determine variance and percentage variance, format figures with colour codes, and add KPI cards, a combo chart and slicers. While taught using expenditure records, salary review costs follow the same structure.
- 115 FinanceGuard budget vs actual dashboard Excel project overview 3 min
- 116 Excel tables for budget and actual data Organise the FinanceGuard datasets 4 min
- 117 Budget vs actual model in Excel SORT, UNIQUE, VSTACK, LET, TEXTSPLIT, SUMIFS 8 min
- 118 Budget variance in Excel Calculate variance and percent variance 4 min
- 119 Custom number formats in Excel Show budget variances with colours and signs 2 min
- 120 PivotTables for budget vs actual The FinanceGuard pivot workspace 8 min
- 121 KPI cards in Excel Summary cards for a budget variance dashboard 4 min
- 122 Budget vs actual charts in Excel Combo chart with secondary axis for variance 5 min
- 123 Slicers and PivotCharts in Excel Interactive FinanceGuard budget dashboard 4 min
- 124 Finish the FinanceGuard dashboard in Excel Final polish and variance insights 10 min
Instructors
Who teaches it.

Instructor, Excel with AI
Virginia Thorn
Emmy Award winner. Teaches Excel with AI at Coding Liquids.
Questions
Asked before starting.
Is an Excel course available for compensation and benefits analysts?
Yes. The Complete Excel Course with AI Integration from Coding Liquids covers the spreadsheet capabilities central to reward operations: salary band lookups, two-way merit grid lookups, IF and IFS formulas for incentive brackets, PivotTable summaries by department or grade, and budget versus actual modelling for pay reviews. The 47 lessons highlighted here represent 3 hours 47 minutes out of the course's 16 hours.
Can compensation and benefits analysts build a merit matrix in Excel through this course?
The underlying lookup mechanics, yes. In The Complete Excel Course with AI Integration, you learn the two-way lookup of XLOOKUP, which retrieves an entry from a grid using row and column coordinates, such as evaluating a performance rating against position in range, alongside INDEX and MATCH as a flexible option instead of VLOOKUP. The course does not construct a merit matrix directly, since its lookup lessons use the PeopleInsight HR dataset.
How do compensation and benefits analysts calculate target-based bonus payouts in Excel?
Through the target-evaluation formulas presented in The Complete Excel Course with AI Integration: basic IF for single benchmarks, nested IF and IFS for multi-tiered structures, AND and OR when rewards depend on satisfying two conditions, and SUMIFS to aggregate total awards by team. Although the demonstrations categorise sales achievements and customer groups, bonus plans rely on the same logic.
Does the course cover pay equity statistics or regression pay lines for compensation analysts?
No. There are no lessons in The Complete Excel Course with AI Integration addressing regression models, salary lines, job evaluation frameworks or statistical pay equity analysis. It provides the preparatory components for pay gap investigations: PivotTables for breaking down pay by gender, department and grade, slicer controls to filter groups, and box and whisker plots for illustrating pay dispersion.
Can this course help a compensation and benefits analyst cost an annual pay review?
Yes, using the budget versus actual framework developed in FinanceGuard. Inside The Complete Excel Course with AI Integration, you create separate actual and budget tables, link them using SUMIFS and dynamic arrays, compute numerical and percentage variance formatted with colours, and design KPI cards plus a combo chart. Even though the exercises model general expenditure, evaluating salary increase costs against an allocated review budget uses the same layout.
Excel with AI
See the whole course.
The Complete Excel Course with AI Integration: 16 hours of video in 186 lessons, built around 14 projects, with lifetime access, a Certificate of Completion and a 14-day money-back guarantee.
The same course
For another job, level or topic.
By job
Finance and accounting
- Accountants and finance teams
- Bookkeepers and accounts assistants
- FP&A and budget analysts
- Auditors and fraud examiners
- Payroll administrators
- Tax accountants and advisers
- Banking professionals
- Cost and management accountants
- Financial controllers
- Credit control and receivables teams
- Accounts payable teams
- Financial planners and advisers
- Credit analysts and loan officers
- Insurance underwriters
- Insurance claims handlers
- Reconciliation analysts
- Treasury analysts
- Medical billing and coding specialists
- Fund accountants
- Billing administrators
- AML and KYC analysts
- Actuarial analysts
- Insurance agents and brokers
HR and office administration
Operations and supply chain
- Operations and project managers
- Procurement and purchasing officers
- Logistics coordinators
- Inventory controllers and storekeepers
- Supply chain analysts
- Warehouse managers and supervisors
- PMO analysts
- Import and export coordinators
- Production planners
- Demand planners
- Fleet and transport managers
- Apparel merchandisers
Data and reporting
Sales, marketing and customer service
Business and management
Engineering, construction and manufacturing
- Quantity surveyors and estimators
- Civil and site engineers
- Quality managers and engineers
- Construction project managers
- Health and safety officers
- Document controllers
- Production managers and supervisors
- Mechanical and electrical engineers
- Industrial engineers
- Planning engineers
- Sustainability and ESG analysts
- Maintenance planners