



The Complete Excel Course with AI Integration
Excel course for civil engineers
Civil and site engineers managing quantity sheets, daily reports and site logs can use the Excel methods in The Complete Excel Course with AI Integration. It contains no site data; this guide selects quantity formulas, conditional materials totals, labour and plant PivotTables, progress charts and TaskFlow for RFI, drawing and inspection records.
Taught by Sagnik Bhattacharya and Virginia Thorn

What you will be able to do
At work, you will be able to:
- Calculate excavation, concrete and brickwork quantities from dimensions, using an absolute reference to keep the wastage allowance in a single cell.
- Use SUMIFS to reconcile receipts, usage and remaining stock for each material, with IF identifying low stock.
- Summarise labour and plant hours for each activity and week in a PivotTable, using date grouping and slicers to filter the results.
- Compare planned and actual progress in line and combo charts, with a sparkline alongside each activity showing its daily trend.
- Maintain drawing, RFI and inspection records using status drop-downs, colour for overdue entries and NETWORKDAYS to count working days until replies are due.
- Organise daily reports, materials records and notes within a workbook, keeping long logs usable with filters and frozen headings.
Projects
What you will build.
The course has 14 projects. These four matter most here.
-
Project 07
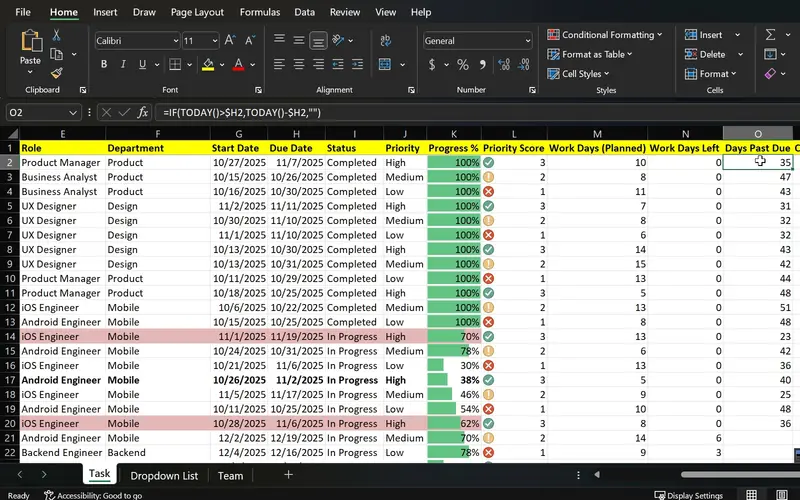
TaskFlow
One sheet that shows what is done, what is late and what is urgent.
Give each RFI or inspection its own row, recording the owner, when it was raised and when a reply is due. Show it as a timeline bar and colour it when overdue.
-
Project 04
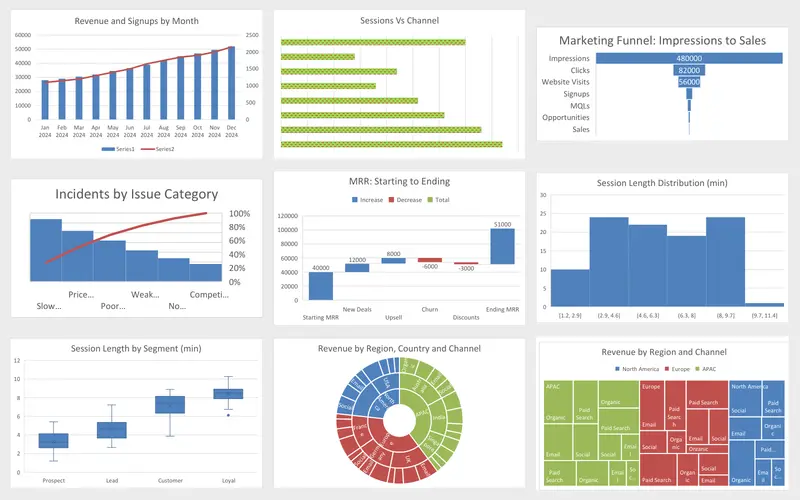
Marketing Engagement Dashboard
Nine charts, each picked for the question it answers.
Match site reporting to the chart: weekly quantities placed in columns, planned versus actual progress as lines, and measurements on two scales in a combo chart.
-
Project 05
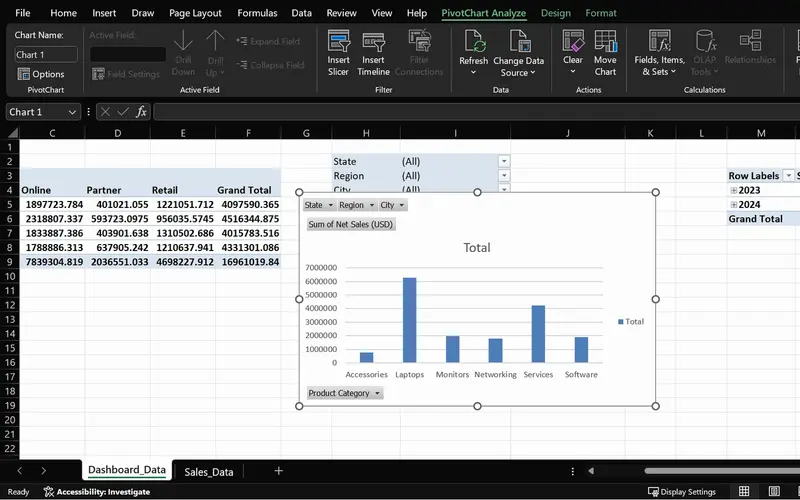
SalesPlusPerformance
A sales question answered in seconds, straight from the order data.
Apply the course's summaries of orders by region and month to daily returns, totalling labour and plant hours by activity, trade and week.
-
Project 03
Sales Goal Tracker
Check stock against reorder levels with IF, count inspections at each status with COUNTIFS, and use SUMIFS to total each material's deliveries and usage.
Lessons
The lessons that matter, in course order.
The Complete Excel Course with AI Integration has 186 lessons. This page picks out 51 of them, 4 h 11 min of video. Each lesson keeps its number in the course.
Where to start
Lesson 5 Your first Excel spreadsheet
Start at Lesson 5, where the budget basics lead on to the formulas a quantity sheet needs, if you can already open Excel and navigate a sheet. For a first introduction to Excel, use Lesson 1. If you already understand formulas and absolute references, start the formulas for materials checks at Lesson 28, or begin TaskFlow for site logs at Lesson 79.
51 of 186 lessons · 4 h 11 min
01 Microsoft Excel fundamentals: building a foundation from scratch A personal budget provides the practice for formulas you can use in quantity sheets: multiply length, width and depth, add totals with SUM and calculate percentages. Use absolute references for a fixed wastage allowance or unit weight, handle errors with IFERROR and organise the workbook into sheets with separate purposes.
- 5 Start here Your first Excel spreadsheet Cells, rows, columns and data types in a budget 8 min
- 6 Number formatting in Excel Currency, date and percentage formats for a budget 5 min
- 7 Cell formatting in Excel AutoFit column width, the #### error and cell styles 6 min
- 8 Basic maths in Excel Add, subtract, multiply and divide with formulas 3 min
- 9 SUM and AutoSum in Excel Total income, expenses and savings with MAX 6 min
- 10 Relative vs absolute references in Excel Dollar signs and mixed references 3 min
- 11 Calculating percentages in Excel Each expense as a percentage of income 2 min
- 12 Common Excel errors and how to fix them DIV0, NAME, VALUE errors and IFERROR 4 min
- 13 Organising an Excel workbook Dashboard, transactions and notes sheets 2 min
03 Managing data in Excel: sort, filter and tables (Dunder Michael Paper employee database) Turn site records into Excel Tables that you can sort by activity or date, then filter to a particular subcontractor, material or area.
- 19 Excel tables Create and format a table, structured references and total row 8 min
- 20 Sorting data in Excel Single and multi-level sort on an employee database 6 min
- 21 Filtering data in Excel AutoFilter, text and number filters on employee data 10 min
03 Managing data in Excel: sort, filter and tables (Dunder Michael Paper employee database) Keep daily log headings visible as you scroll through entries by freezing panes.
- 26 Freeze panes in Excel Lock header rows and columns while scrolling 3 min
04 Essential formulas and functions (IF, SUMIF and more) Practise on sales figures, then apply IF to stock below its reorder level and AND or OR to checks involving two conditions. SUMIFS and COUNTIFS support totals and counts for deliveries and usage by material and date, while date functions support daily records.
- 28 Logical functions in Excel TRUE and FALSE comparisons for beginners 5 min
- 29 The IF function in Excel Pass or fail results with a single condition 3 min
- 30 IF function practice in Excel Categorise sales data with IF formulas 6 min
- 31 Nested IF and IFS in Excel Customer value tiers with nested IF 6 min
- 32 Nested IF and IFS in Excel Sales performance labels with the IFS function 5 min
- 33 AND and OR with IF in Excel Flag high-value deals with multiple conditions 8 min
- 34 SUM, COUNT and COUNTA in Excel SUM with FILTER and counting numbers with COUNT 7 min
- 35 SUM, COUNT and COUNTA in Excel COUNTA, unique counts and completeness checks 4 min
- 36 SUMIF and COUNTIF in Excel Conditional sum and count with one criterion 8 min
- 37 SUMIFS and COUNTIFS in Excel Sum and count with multiple criteria 7 min
- 38 The Excel function library Insert Function dialog and Formula AutoComplete 5 min
- 39 Date and time functions in Excel TODAY, NOW, MONTH and date arithmetic 6 min
06 Data visualisation: charts and graphs Present quantities placed in column charts and compare planned with actual progress using a line chart. Build combo charts with a secondary axis, format charts clearly and add sparklines within cells for progress reports.
- 48 Choosing the right Excel chart Column, line, pie, combo and modern chart types 4 min
- 49 Column charts in Excel Insert, format and label a column chart 5 min
- 50 Line charts in Excel Show trends over time with a line chart 4 min
- 51 Pie charts in Excel Show proportions and parts of a whole 4 min
- 52 Combo charts in Excel Column and line chart with a secondary axis 4 min
- 53 Formatting charts in Excel Titles, data labels, colours and chart styles 7 min
- 54 Sparklines in Excel Line, column and win-loss mini charts in cells 5 min
07 PivotTables and PivotCharts: data analysis made easy The sales-order lessons show how PivotTables summarise lists, a method you can also use for daily labour and plant returns. Analyse hours by trade, activity and week with date grouping, slicers and PivotCharts.
- 57 PivotTables 101 in Excel What a PivotTable does and the sales dataset 5 min
- 58 Preparing data for PivotTables Clean data with TRIM, PROPER, find and replace 5 min
- 59 Create your first PivotTable in Excel Insert a PivotTable from a sales table 1 min
- 60 PivotTable fields in Excel Rows, values, columns and Value Field Settings 2 min
- 61 PivotTable summaries in Excel Sales by product category and grouping by date 4 min
- 62 Slicers in Excel Filter PivotTables with clickable buttons 3 min
- 63 PivotCharts in Excel Create interactive charts from a PivotTable 5 min
- 64 PivotTable design Tab Report layouts, PivotTable styles and number formats 5 min
- 65 Refresh a PivotTable in Excel Update pivots when source data changes 2 min
- 66 Excel Ninja Challenge PivotTable sales by region, category and monthly trend 1 min
09 Project: task automation with data validation and forms Adapt TaskFlow's task-tracking approach to an inspection log, drawing register or RFI log. Its protected sheet combines priority and status drop-downs, highlighting for overdue entries, a Gantt-style timeline and NETWORKDAYS calculations for working days remaining.
- 79 TaskFlow project tracker in Excel Overview of the task tracker dashboard 4 min
- 80 Designing a task tracker in Excel TaskFlow layout, columns and headers 5 min
- 81 Data validation in Excel Status and priority drop-down lists in TaskFlow 8 min
- 82 Conditional formatting in Excel Highlight overdue and completed tasks 8 min
- 83 Gantt chart in Excel Build a project timeline with conditional formatting 6 min
- 84 Data bars and icon sets in Excel Visual priority and progress in TaskFlow 6 min
- 85 NETWORKDAYS and TODAY in Excel Days remaining and task deadlines in TaskFlow 5 min
- 86 Protect a sheet and lock cells in Excel Secure the TaskFlow tracker workbook 4 min
- 87 Testing an Excel task tracker Stress test TaskFlow with sample data 3 min
Instructors
Who teaches it.

Instructor, Excel with AI
Virginia Thorn
Emmy Award winner. Teaches Excel with AI at Coding Liquids.
Questions
Asked before starting.
Which Excel course should a civil or site engineer choose?
The Complete Excel Course with AI Integration from Coding Liquids teaches Excel methods that support site records and reporting. These include PivotTables for labour and plant hours, SUMIFS totals for materials received and used, formulas with absolute references for quantities from dimensions, line charts for planned against actual progress, and TaskFlow for RFI and inspection logs. This page selects 51 lessons, taking 4 hours 11 minutes.
Can a civil engineer use this course to calculate concrete and brickwork quantities in Excel?
Yes, provided you supply the dimensions and calculation rules. The opening lessons in The Complete Excel Course with AI Integration use a personal budget to teach cell multiplication, SUM totals, absolute references that hold one figure in a single cell, such as your wastage allowance or unit weight, and IFERROR to catch formula errors. Those formulas also apply to a quantity sheet. The course does not cover bar bending schedules.
How can a site engineer manage RFI, drawing and inspection logs on a single sheet?
Follow the TaskFlow approach taught in The Complete Excel Course with AI Integration. Record an RFI as a row containing its owner, the date raised and the reply deadline. The project teaches a task tracker with status drop-downs, conditional formatting to colour overdue and closed entries, TODAY and NETWORKDAYS to calculate working days until each deadline, and sheet protection to preserve formulas. These methods also suit drawing and inspection records.
Does this course teach civil engineers structural design, AutoCAD or Primavera?
No. The teaching in The Complete Excel Course with AI Integration is limited to Excel: it does not cover structural design, bar bending schedules, quantity take-off rules, AutoCAD or Primavera. For a site engineer, it supports the accompanying workbooks, including materials balances, quantity sheets, daily reports, progress charts and logs.
Can a site engineer plot planned versus actual progress for a site meeting?
Yes. In The Complete Excel Course with AI Integration, the chart lessons teach trends with line charts, combo charts using a secondary axis for two scales, readable formatting and sparklines within cells. Plot weekly planned and actual percentages as separate lines. To show cumulative progress, build a running total from the weekly figures using SUM with a mixed reference.
Excel with AI
See the whole course.
The Complete Excel Course with AI Integration: 16 hours of video in 186 lessons, built around 14 projects, with lifetime access, a Certificate of Completion and a 14-day money-back guarantee.
The same course
For another job, level or topic.
By job
Finance and accounting
- Accountants and finance teams
- Bookkeepers and accounts assistants
- FP&A and budget analysts
- Auditors and fraud examiners
- Payroll administrators
- Tax accountants and advisers
- Banking professionals
- Cost and management accountants
- Financial controllers
- Credit control and receivables teams
- Accounts payable teams
- Financial planners and advisers
- Credit analysts and loan officers
- Insurance underwriters
- Insurance claims handlers
- Reconciliation analysts
- Treasury analysts
- Medical billing and coding specialists
- Fund accountants
- Billing administrators
- AML and KYC analysts
- Actuarial analysts
- Insurance agents and brokers
HR and office administration
Operations and supply chain
- Operations and project managers
- Procurement and purchasing officers
- Logistics coordinators
- Inventory controllers and storekeepers
- Supply chain analysts
- Warehouse managers and supervisors
- PMO analysts
- Import and export coordinators
- Production planners
- Demand planners
- Fleet and transport managers
- Apparel merchandisers
Data and reporting
Sales, marketing and customer service
Business and management
Engineering, construction and manufacturing
- Quantity surveyors and estimators
- Quality managers and engineers
- Construction project managers
- Health and safety officers
- Document controllers
- Production managers and supervisors
- Mechanical and electrical engineers
- Industrial engineers
- Planning engineers
- Sustainability and ESG analysts
- Maintenance planners