



The Complete Excel Course with AI Integration
Excel course for healthcare administrators
For hospital, clinic and practice administrators reporting on activity, staffing and spending in Excel. Although The Complete Excel Course with AI Integration has no healthcare data of its own, this page selects the lessons behind those reports. It spotlights COUNTIFS and SUMIFS for clinics and rosters, monthly ward activity PivotTables, TaskFlow for renewals and audits, the FinanceGuard budget report, and MarketPulse as a dashboard model.
Taught by Sagnik Bhattacharya and Virginia Thorn

What you will be able to do
At work, you will be able to:
- Tally booked and missed clinic appointments by month using COUNTIFS, and determine the no-show rate through a ratio protected by IFERROR.
- Calculate rostered shifts and total hours by staff grade and ward from an exported roster using SUMIFS and COUNTIFS.
- Aggregate ward admissions and occupied bed days by month in PivotTables, and determine patient length of stay with date arithmetic.
- Track professional registrations, mandatory training and audit dates in a workbook that colours any entry that has lapsed or is due soon.
- Compare a department's budget with actual spending using variance, percentage variance and colour-coded number formatting.
- Assemble a single-page management meeting dashboard equipped with KPI cards, PivotCharts, interactive slicers and a timeline.
Projects
What you will build.
The course has 14 projects. These five matter most here.
-
Project 05
SalesPlusPerformance
A sales question answered in seconds, straight from the order data.
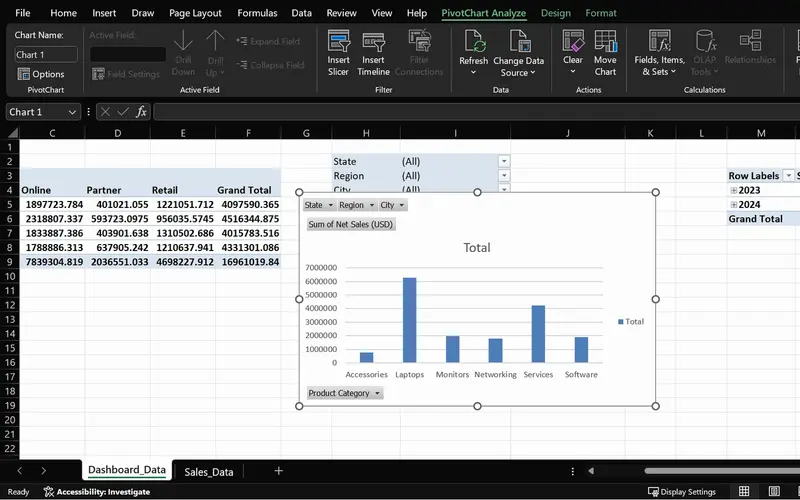
Consolidate activity by clinic, ward and month into a single PivotTable, with grouped dates, site slicers and Refresh All for incoming monthly exports.
-
Project 07
TaskFlow
One sheet that shows what is done, what is late and what is urgent.
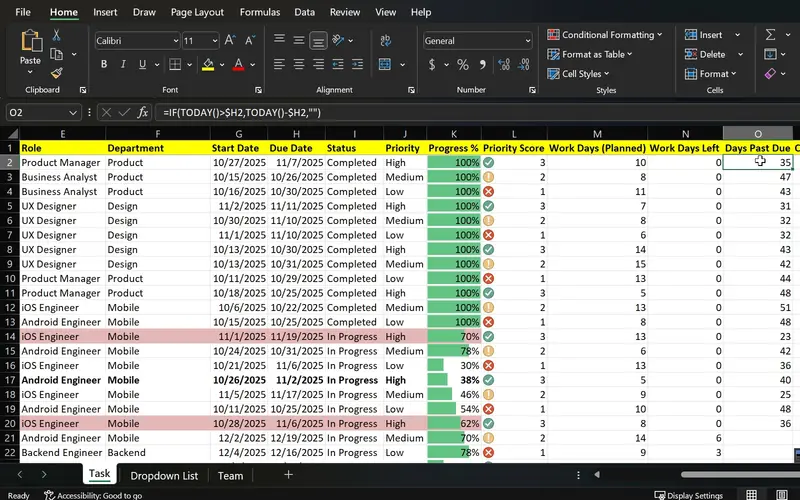
Build an audit and renewal tracker where each entry has a status and due date, nearing or lapsed deadlines are coloured, and remaining working days are counted.
-
Project 08
MarketPulse
One screen that shows which campaigns earn back their spend.
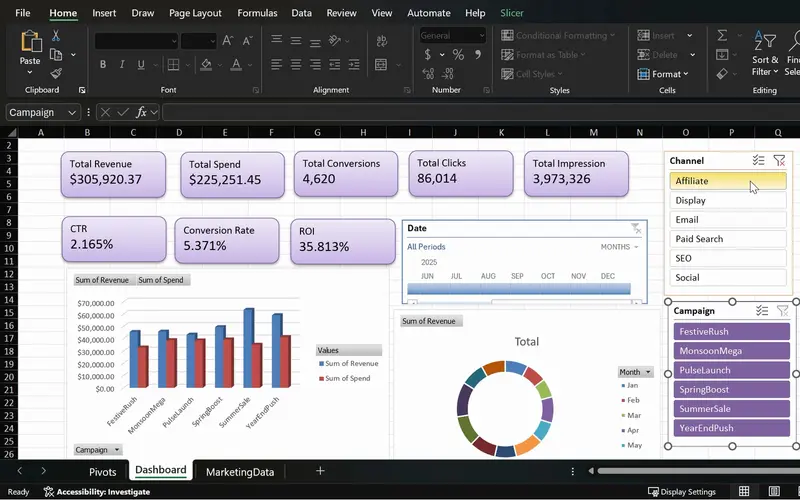
Design a one-page management dashboard layout featuring KPI cards, PivotCharts, slicers, a timeline and ratio KPIs like no-show rates guarded by IFERROR.
-
Project 09
FinanceGuard
The budget vs actual report finance teams send every month.
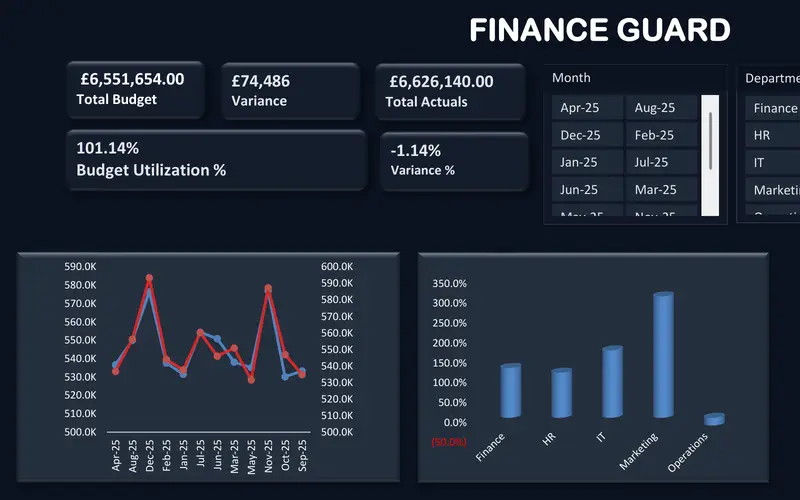
Present departmental budgets against actual expenditure by month and cost heading, colouring overspends and filtering departments with slicers.
-
Project 03
Sales Goal Tracker
Apply COUNTIFS for attended and missed appointments by clinic and month, SUMIFS for rostered hours by grade, and IF to flag clinics exceeding waiting time targets.
Lessons
The lessons that matter, in course order.
The Complete Excel Course with AI Integration has 186 lessons. This page picks out 52 of them, 4 h 21 min of video. Each lesson keeps its number in the course.
Where to start
Lesson 28 Logical functions in Excel
Start at Lesson 28 if you already enter data and write simple formulas, since counting clinic appointments begins with IF and COUNTIFS. Anyone new to spreadsheets should begin at Lesson 1, where the training builds step by step towards this material. If you already use COUNTIFS and PivotTables regularly, jump straight to Lesson 105 for the management dashboard, or move to Lesson 115 to start comparing budgets against actual expenditure.
52 of 186 lessons · 4 h 21 min
04 Essential formulas and functions (IF, SUMIF and more) Counts and totals for clinic operations: apply COUNTIF and COUNTIFS for attended and missed appointments by clinic and month, SUMIF and SUMIFS for rostered hours by grade, IF and IFS to flag waiting times above target, and date arithmetic for length of stay and waiting durations. The exercises use sales data.
- 28 Start here Logical functions in Excel TRUE and FALSE comparisons for beginners 5 min
- 29 The IF function in Excel Pass or fail results with a single condition 3 min
- 30 IF function practice in Excel Categorise sales data with IF formulas 6 min
- 31 Nested IF and IFS in Excel Customer value tiers with nested IF 6 min
- 32 Nested IF and IFS in Excel Sales performance labels with the IFS function 5 min
- 33 AND and OR with IF in Excel Flag high-value deals with multiple conditions 8 min
- 34 SUM, COUNT and COUNTA in Excel SUM with FILTER and counting numbers with COUNT 7 min
- 35 SUM, COUNT and COUNTA in Excel COUNTA, unique counts and completeness checks 4 min
- 36 SUMIF and COUNTIF in Excel Conditional sum and count with one criterion 8 min
- 37 SUMIFS and COUNTIFS in Excel Sum and count with multiple criteria 7 min
- 38 The Excel function library Insert Function dialog and Formula AutoComplete 5 min
- 39 Date and time functions in Excel TODAY, NOW, MONTH and date arithmetic 6 min
- 40 Excel Ninja Challenge COUNTIF, SUMIF, IF, COUNTIFS, SUMIFS and IFS practice 8 min
07 PivotTables and PivotCharts: data analysis made easy Summarise clinic and ward activity by month in PivotTables: group dates, insert site slicers, generate PivotCharts, maintain a clean layout and use refresh when subsequent monthly extracts are added. Sales orders form the basis of the lessons, but healthcare activity extracts summarise the same way.
- 57 PivotTables 101 in Excel What a PivotTable does and the sales dataset 5 min
- 58 Preparing data for PivotTables Clean data with TRIM, PROPER, find and replace 5 min
- 59 Create your first PivotTable in Excel Insert a PivotTable from a sales table 1 min
- 60 PivotTable fields in Excel Rows, values, columns and Value Field Settings 2 min
- 61 PivotTable summaries in Excel Sales by product category and grouping by date 4 min
- 62 Slicers in Excel Filter PivotTables with clickable buttons 3 min
- 63 PivotCharts in Excel Create interactive charts from a PivotTable 5 min
- 64 PivotTable design Tab Report layouts, PivotTable styles and number formats 5 min
- 65 Refresh a PivotTable in Excel Update pivots when source data changes 2 min
- 66 Excel Ninja Challenge PivotTable sales by region, category and monthly trend 1 min
09 Project: task automation with data validation and forms Use TaskFlow as an audit and renewal tracking system: select priority and status from drop-down menus, highlight overdue or lapsed entries, include a timeline, calculate remaining working days and protect the worksheet. The lessons track tasks, but renewal records and audit dates fit the same columns.
- 79 TaskFlow project tracker in Excel Overview of the task tracker dashboard 4 min
- 80 Designing a task tracker in Excel TaskFlow layout, columns and headers 5 min
- 81 Data validation in Excel Status and priority drop-down lists in TaskFlow 8 min
- 82 Conditional formatting in Excel Highlight overdue and completed tasks 8 min
- 83 Gantt chart in Excel Build a project timeline with conditional formatting 6 min
- 84 Data bars and icon sets in Excel Visual priority and progress in TaskFlow 6 min
- 85 NETWORKDAYS and TODAY in Excel Days remaining and task deadlines in TaskFlow 5 min
- 86 Protect a sheet and lock cells in Excel Secure the TaskFlow tracker workbook 4 min
- 87 Testing an Excel task tracker Stress test TaskFlow with sample data 3 min
11 MarketPulse campaign intelligence dashboard Use MarketPulse to design a management dashboard: clean data, define measures, build ratio KPIs guarded with IFERROR, and arrange PivotTables, KPI cards, charts, slicers and a timeline on a single page. While the project tracks marketing campaigns, clinic and ward metrics follow the same build.
- 105 MarketPulse marketing dashboard in Excel Project overview and campaign data 4 min
- 106 Clean and check marketing data in Excel Remove duplicates, Copilot KPI plan 4 min
- 107 Plan a marketing dashboard with ChatGPT KPIs and the PivotTable strategy 4 min
- 108 Marketing PivotTables in Excel Build the MarketPulse pivot back end 6 min
- 109 CTR, conversion rate and ROI in Excel Marketing KPI formulas with IFERROR 4 min
- 110 PivotTables with Copilot Generate and verify marketing pivots in Excel 6 min
- 111 Marketing charts and a timeline in Excel MarketPulse dashboard PivotCharts 4 min
- 112 KPI cards in Excel Marketing KPI cards for the MarketPulse dashboard 7 min
- 113 Slicers for an Excel dashboard Interactive filtering in MarketPulse 4 min
- 114 Polish an Excel marketing dashboard Final formatting and insights in MarketPulse 9 min
12 Project: FinanceGuard budget variance analyser (budget vs actual Excel dashboard) Apply FinanceGuard to monitor departmental budgets: construct budget and actual tables, calculate variance and percentage variance, apply custom number formatting that colours overspends, and assemble PivotTables, KPI cards, a combo chart and slicers. The lessons use a company budget, but departmental cost headings use the same columns.
- 115 FinanceGuard budget vs actual dashboard Excel project overview 3 min
- 116 Excel tables for budget and actual data Organise the FinanceGuard datasets 4 min
- 117 Budget vs actual model in Excel SORT, UNIQUE, VSTACK, LET, TEXTSPLIT, SUMIFS 8 min
- 118 Budget variance in Excel Calculate variance and percent variance 4 min
- 119 Custom number formats in Excel Show budget variances with colours and signs 2 min
- 120 PivotTables for budget vs actual The FinanceGuard pivot workspace 8 min
- 121 KPI cards in Excel Summary cards for a budget variance dashboard 4 min
- 122 Budget vs actual charts in Excel Combo chart with secondary axis for variance 5 min
- 123 Slicers and PivotCharts in Excel Interactive FinanceGuard budget dashboard 4 min
- 124 Finish the FinanceGuard dashboard in Excel Final polish and variance insights 10 min
Instructors
Who teaches it.

Instructor, Excel with AI
Virginia Thorn
Emmy Award winner. Teaches Excel with AI at Coding Liquids.
Questions
Asked before starting.
Is there an Excel course suited to hospital and clinic administrators?
Yes. The Complete Excel Course with AI Integration from Coding Liquids covers the spreadsheet skills used in hospital and clinic offices: COUNTIFS for appointments and missed visits by clinic and month, SUMIFS for staff roster hours by grade, PivotTables for ward activity, the TaskFlow tracker for training and licence renewals, the FinanceGuard budget vs actual report and a one-page dashboard patterned after MarketPulse. The exercises draw on sales, marketing and budget data. In total, this page highlights 52 lessons, taking 4 hours 21 minutes.
Can clinic and hospital administrators report no-show rates and waiting times?
Yes. With what The Complete Excel Course with AI Integration teaches, COUNTIFS counts booked and missed appointments across clinics and months, simple division calculates the no-show rate, and IFERROR ensures clinics with no bookings do not produce errors. Date arithmetic determines the days elapsed between referral and appointment, whilst IF or IFS flags waits that breach targets. A PivotTable then arranges clinics against months on a single sheet. The lessons track sales figures, but an appointment export counts the same way.
Can hospital administrators flag training and licences that are due to lapse?
Yes. The TaskFlow project in The Complete Excel Course with AI Integration creates a tracking spreadsheet using status drop-downs, conditional formatting for overdue deadlines, and NETWORKDAYS with TODAY to tally remaining working days. Assign each staff member's registration, mandatory training and audit its own row with a renewal date, and the formatting rules colour lapsed items and impending deadlines on a sheet locked against accidental edits.
Can healthcare administrators build a dashboard for management meetings?
Yes. By following MarketPulse in The Complete Excel Course with AI Integration, administrators learn a dashboard build that transfers directly: data is cleaned and verified, metrics are planned, PivotTables serve as the back end, ratio KPIs are protected by IFERROR, and KPI cards display headline numbers alongside PivotCharts, slicers and a timeline on a single page. Simply replace marketing campaigns with clinics or wards, and substitute click-through rate with bed occupancy or no-show rates.
Does the course cover hospital information systems or patient records for hospital administrators?
No. The Complete Excel Course with AI Integration teaches Excel: none of the lessons use patient data, and clinical coding, hospital information systems and patient data regulations are not covered. Your organisation's own governance policies determine which records may be exported to a spreadsheet and how they must be stored. The course focuses on spreadsheet analysis once the numbers are in hand: counts, rates, rosters, renewals, budgets and dashboards.
Excel with AI
See the whole course.
The Complete Excel Course with AI Integration: 16 hours of video in 186 lessons, built around 14 projects, with lifetime access, a Certificate of Completion and a 14-day money-back guarantee.
The same course
For another job, level or topic.
By job
Finance and accounting
- Accountants and finance teams
- Bookkeepers and accounts assistants
- FP&A and budget analysts
- Auditors and fraud examiners
- Payroll administrators
- Tax accountants and advisers
- Banking professionals
- Cost and management accountants
- Financial controllers
- Credit control and receivables teams
- Accounts payable teams
- Financial planners and advisers
- Credit analysts and loan officers
- Insurance underwriters
- Insurance claims handlers
- Reconciliation analysts
- Treasury analysts
- Medical billing and coding specialists
- Fund accountants
- Billing administrators
- AML and KYC analysts
- Actuarial analysts
- Insurance agents and brokers
HR and office administration
Operations and supply chain
- Operations and project managers
- Procurement and purchasing officers
- Logistics coordinators
- Inventory controllers and storekeepers
- Supply chain analysts
- Warehouse managers and supervisors
- PMO analysts
- Import and export coordinators
- Production planners
- Demand planners
- Fleet and transport managers
- Apparel merchandisers
Data and reporting
Sales, marketing and customer service
Business and management
Engineering, construction and manufacturing
- Quantity surveyors and estimators
- Civil and site engineers
- Quality managers and engineers
- Construction project managers
- Health and safety officers
- Document controllers
- Production managers and supervisors
- Mechanical and electrical engineers
- Industrial engineers
- Planning engineers
- Sustainability and ESG analysts
- Maintenance planners