



The Complete Excel Course with AI Integration
Excel course for insurance claims handlers
For claims handlers and claims assistants who keep their claims log, diary and weekly figures in Excel. This page picks out the parts of The Complete Excel Course with AI Integration that claims work uses: a clean log in an Excel Table, ageing against service standards, checks of payments against reserves and limits, duplicate checks, PivotTables by cause and region, a claims diary built from TaskFlow, and AI as a first pass that you always check.
Taught by Sagnik Bhattacharya and Virginia Thorn

What you will be able to do
At work, you will be able to:
- Keep the claims log as an Excel Table that sorts and filters by status, handler or cause, cleaned of stray spaces and repeated rows.
- Age every open claim from its notification date with TODAY and IFS, and flag the ones past your service standard in colour.
- Check each payment against the reserve and the policy limit with XLOOKUP and IF with AND and OR, and mark the claims that need a second look.
- Spot possible duplicate claims with COUNTIFS on policy, loss date and amount, and let Copilot point to suspect rows before you check them yourself.
- Summarise claims by cause, region and month with PivotTables and slicers, and put the week's figures on one page with Copilot's help.
- Run a claims diary with drop-down statuses, the working days left to each target date from NETWORKDAYS, and a protected sheet.
Projects
What you will build.
The course has 14 projects. These four matter most here.
-
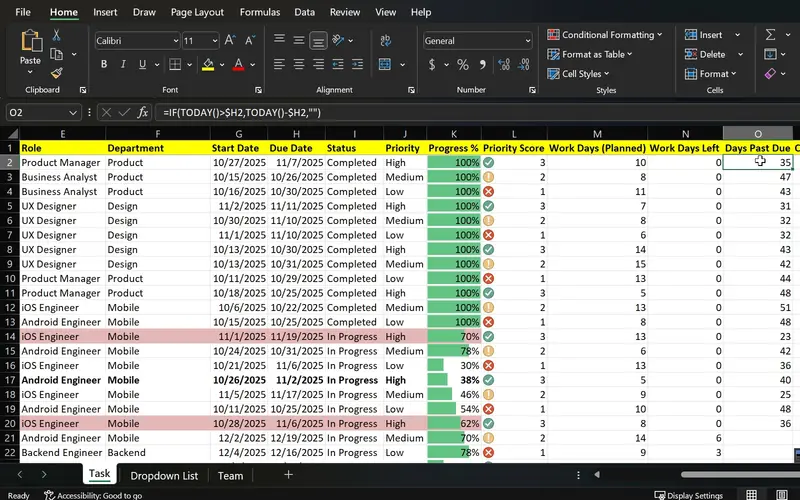
Project 07
TaskFlow
One sheet that shows what is done, what is late and what is urgent.
A task tracker turned claims diary: each claim's status from a drop-down list, the working days left to its service standard, and a locked sheet the team can update.
-
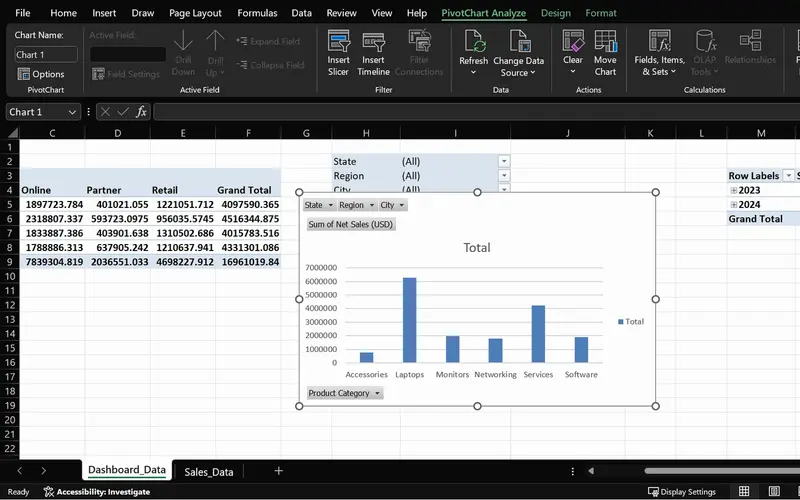
Project 05
SalesPlusPerformance
A sales question answered in seconds, straight from the order data.
Claims counted and totalled by cause, region and month of loss with the clicks the lessons apply to orders, and a slicer for each handler or team.
-
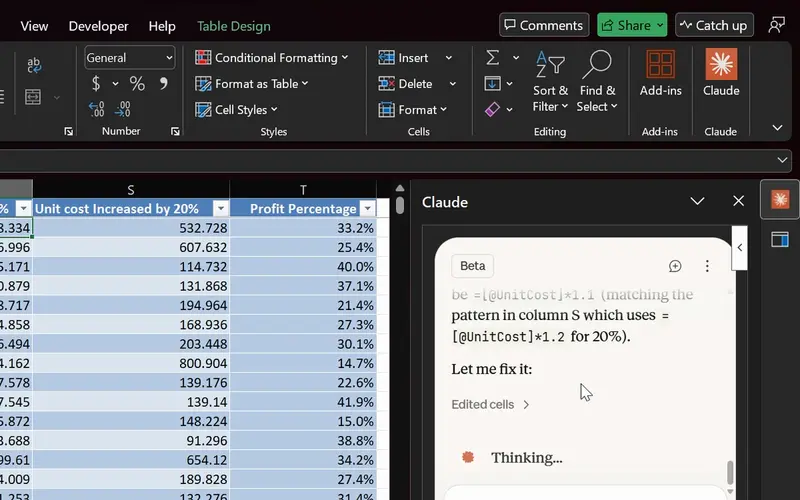
Project 14
Agentic AI in Excel
AI finds and fixes the formula; you check it before it counts.
A first pass over a claims listing, practised on sales data: Copilot points to suspect rows and odd figures, and nothing is referred until a QA checklist has been run.
-
Project 02
Dunder Michael Paper Company employee database
A long list kept in order, practised on employee records: the tables, sorts, filters and clean-up a claims log needs before any figure is trusted.
Lessons
The lessons that matter, in course order.
The Complete Excel Course with AI Integration has 186 lessons. This page picks out 56 of them, 4 h 52 min of video. Each lesson keeps its number in the course.
Where to start
Lesson 19 Excel tables
Begin at Lesson 19 if you already keep a claims log in Excel: a clean, sortable table comes first. That section, Managing data in Excel, is free by email with its practice files: ask for it on the course page. New to Excel? Begin at Lesson 1. If tables and IF formulas are routine, go to Lesson 57 for PivotTables or Lesson 88 for the AI lessons.
56 of 186 lessons · 4 h 52 min
03 Managing data in Excel: sort, filter and tables (Dunder Michael Paper employee database) The claims log in order: Excel Tables, sorting and filtering by status or handler, cleaning with TRIM and Find and Replace, Remove Duplicates for rows exported twice, Flash Fill and Text to Columns for names and references, frozen headers and printing. The lessons use an employee database.
- 19 Start here Excel tables Create and format a table, structured references and total row 8 min
- 20 Sorting data in Excel Single and multi-level sort on an employee database 6 min
- 21 Filtering data in Excel AutoFilter, text and number filters on employee data 10 min
- 22 Cleaning data in Excel TRIM, Paste Special values and Find and Replace 13 min
- 23 Remove duplicates in Excel Find and delete duplicate rows in an employee list 6 min
- 24 Flash Fill in Excel Split first and last names automatically 3 min
- 25 Text to Columns in Excel Split data by delimiter into separate columns 6 min
- 26 Freeze panes in Excel Lock header rows and columns while scrolling 3 min
- 27 Printing in Excel Print area, page orientation, scaling and page layout 6 min
04 Essential formulas and functions (IF, SUMIF and more) Claims rules as formulas: IF and IFS for ageing bands, AND and OR for a payment that exceeds the reserve or the policy limit, COUNTIFS for possible duplicates, SUMIFS for paid and reserved amounts by cause, region and month, and TODAY with date arithmetic for days open.
- 28 Logical functions in Excel TRUE and FALSE comparisons for beginners 5 min
- 29 The IF function in Excel Pass or fail results with a single condition 3 min
- 30 IF function practice in Excel Categorise sales data with IF formulas 6 min
- 31 Nested IF and IFS in Excel Customer value tiers with nested IF 6 min
- 32 Nested IF and IFS in Excel Sales performance labels with the IFS function 5 min
- 33 AND and OR with IF in Excel Flag high-value deals with multiple conditions 8 min
- 34 SUM, COUNT and COUNTA in Excel SUM with FILTER and counting numbers with COUNT 7 min
- 35 SUM, COUNT and COUNTA in Excel COUNTA, unique counts and completeness checks 4 min
- 36 SUMIF and COUNTIF in Excel Conditional sum and count with one criterion 8 min
- 37 SUMIFS and COUNTIFS in Excel Sum and count with multiple criteria 7 min
- 38 The Excel function library Insert Function dialog and Formula AutoComplete 5 min
- 39 Date and time functions in Excel TODAY, NOW, MONTH and date arithmetic 6 min
- 40 Excel Ninja Challenge COUNTIF, SUMIF, IF, COUNTIFS, SUMIFS and IFS practice 8 min
07 PivotTables and PivotCharts: data analysis made easy PivotTables, slicers and PivotCharts for claims by cause, region, handler or month of loss, refreshed each week when the new extract replaces the data. The lessons use sales orders.
- 57 PivotTables 101 in Excel What a PivotTable does and the sales dataset 5 min
- 58 Preparing data for PivotTables Clean data with TRIM, PROPER, find and replace 5 min
- 59 Create your first PivotTable in Excel Insert a PivotTable from a sales table 1 min
- 60 PivotTable fields in Excel Rows, values, columns and Value Field Settings 2 min
- 61 PivotTable summaries in Excel Sales by product category and grouping by date 4 min
- 62 Slicers in Excel Filter PivotTables with clickable buttons 3 min
- 63 PivotCharts in Excel Create interactive charts from a PivotTable 5 min
- 64 PivotTable design Tab Report layouts, PivotTable styles and number formats 5 min
- 65 Refresh a PivotTable in Excel Update pivots when source data changes 2 min
- 66 Excel Ninja Challenge PivotTable sales by region, category and monthly trend 1 min
08 Advanced Excel functions: lookups, text and arrays Lookups that bring the reserve, the limit and the excess onto each payment line from the policy or reserve listing (VLOOKUP, XLOOKUP, INDEX and MATCH), with IFERROR for a claim that has no match.
- 67 Lookup functions in Excel The PeopleInsight HR dataset and why lookups matter 2 min
- 68 VLOOKUP in Excel Find employee data across sheets with exact match 4 min
- 69 XLOOKUP in Excel Exact match, if not found and two-way lookup 6 min
- 70 IFERROR in Excel Handle lookup errors in VLOOKUP and XLOOKUP formulas 3 min
- 71 INDEX and MATCH in Excel A flexible alternative to VLOOKUP 6 min
09 Project: task automation with data validation and forms TaskFlow's layout used as a claims diary: one row per claim, a status and a priority from drop-down lists, and highlights for claims that are overdue or closed.
- 79 TaskFlow project tracker in Excel Overview of the task tracker dashboard 4 min
- 80 Designing a task tracker in Excel TaskFlow layout, columns and headers 5 min
- 81 Data validation in Excel Status and priority drop-down lists in TaskFlow 8 min
- 82 Conditional formatting in Excel Highlight overdue and completed tasks 8 min
09 Project: task automation with data validation and forms Data bars and icon sets for progress, the working days left to each target date with NETWORKDAYS and TODAY, and a protected sheet so the team updates statuses without breaking formulas.
- 84 Data bars and icon sets in Excel Visual priority and progress in TaskFlow 6 min
- 85 NETWORKDAYS and TODAY in Excel Days remaining and task deadlines in TaskFlow 5 min
- 86 Protect a sheet and lock cells in Excel Secure the TaskFlow tracker workbook 4 min
10 Boosting productivity with AI in Excel (Copilot, ChatGPT and Claude) AI as a first pass, practised on sales data: what Copilot, ChatGPT and Claude can and cannot do, preparing a table for them, prompts, PivotTables, charts and highlights from a prompt, formula columns you verify, Copilot finding suspect rows, a one-page dashboard and a checklist before anything is relied on.
- 88 AI in Excel What Copilot, ChatGPT and Claude can and cannot do 8 min
- 89 Prepare data for Copilot in Excel Tables, headers and clean structure 6 min
- 90 Copilot executive summary in Excel Summarise a dataset in seconds with AI 5 min
- 91 Copilot prompts for Excel Weak vs strong prompts and the PRO prompt pattern 5 min
- 92 PivotTables with Copilot Build an Excel PivotTable from a prompt 5 min
- 93 Charts with Copilot and ChatGPT Create and choose the right Excel chart 6 min
- 94 Conditional formatting with Copilot and ChatGPT Highlight problems in Excel 4 min
- 95 Excel formulas with AI Copilot and ChatGPT write formula columns you verify 6 min
- 96 Find outliers with Copilot in Excel Discounts, negative profit, suspect rows 7 min
- 97 Clean messy data with Copilot in Excel AI prompts plus Excel functions 4 min
- 98 Mini dashboard with Copilot in Excel KPIs, charts and slicers on one page 3 min
- 99 Check AI output in Excel A quick QA checklist for Copilot results 2 min
Instructors
Who teaches it.

Instructor, Excel with AI
Virginia Thorn
Emmy Award winner. Teaches Excel with AI at Coding Liquids.
Questions
Asked before starting.
Is there an Excel course for insurance claims handlers?
Yes. The Complete Excel Course with AI Integration from Coding Liquids teaches the Excel a claims team works in every day: a claims log kept as an Excel Table, ageing against service standards with TODAY and IFS, payments set against reserves and limits with XLOOKUP, COUNTIFS checks for duplicates, PivotTables by cause and region, and Copilot as a first pass over suspect claims. The 56 lessons here come to 4 hours 52 minutes of the course's 16 hours.
Does it cover claims handling or loss adjusting?
No. The Complete Excel Course with AI Integration teaches Excel, not claims practice: policy wordings, claims law, loss adjusting, reserving methods and claims systems are not covered, and no lesson builds a claims log. It teaches the spreadsheet work around a claim: keeping the list clean, ageing it, checking payments against reserves and limits, and reporting by cause, region and month.
Can AI help me find suspicious or duplicate claims?
As a first pass only. In The Complete Excel Course with AI Integration Copilot looks for suspect rows, odd discounts and negative profit in a sales table, and a QA checklist decides what can be relied on. Duplicates are found with formulas you control: COUNTIFS counts rows with the same policy, loss date and amount, and Remove Duplicates clears rows exported twice. Any claim flagged this way still goes to the people who investigate.
Can I build a weekly claims dashboard in Excel?
Yes. The Complete Excel Course with AI Integration builds the pieces: PivotTables that count and total claims by cause, region and date, PivotCharts and slicers that filter a PivotTable and its chart together, and a lesson where Copilot sets out KPIs, charts and slicers on one sheet. Each week the new extract replaces the data and a refresh brings every figure up to date. The lessons use sales data.
Excel with AI
See the whole course.
The Complete Excel Course with AI Integration: 16 hours of video in 186 lessons, built around 14 projects, with lifetime access, a Certificate of Completion and a 14-day money-back guarantee.
The same course
For another job, level or topic.
By job
Finance and accounting
- Accountants and finance teams
- Bookkeepers and accounts assistants
- FP&A and budget analysts
- Auditors and fraud examiners
- Payroll administrators
- Tax accountants and advisers
- Banking professionals
- Cost and management accountants
- Financial controllers
- Credit control and receivables teams
- Accounts payable teams
- Financial planners and advisers
- Credit analysts and loan officers
- Insurance underwriters
- Reconciliation analysts
- Treasury analysts
- Medical billing and coding specialists
- Fund accountants
- Billing administrators
- AML and KYC analysts
- Actuarial analysts
- Insurance agents and brokers
HR and office administration
Operations and supply chain
- Operations and project managers
- Procurement and purchasing officers
- Logistics coordinators
- Inventory controllers and storekeepers
- Supply chain analysts
- Warehouse managers and supervisors
- PMO analysts
- Import and export coordinators
- Production planners
- Demand planners
- Fleet and transport managers
- Apparel merchandisers
Data and reporting
Sales, marketing and customer service
Business and management
Engineering, construction and manufacturing
- Quantity surveyors and estimators
- Civil and site engineers
- Quality managers and engineers
- Construction project managers
- Health and safety officers
- Document controllers
- Production managers and supervisors
- Mechanical and electrical engineers
- Industrial engineers
- Planning engineers
- Sustainability and ESG analysts
- Maintenance planners