



The Complete Excel Course with AI Integration
Excel course for MBA and business students
For MBA candidates, pre-MBA learners, and business and commerce students analysing cases and creating spreadsheets, this guide highlights relevant material from The Complete Excel Course with AI Integration. It focuses on cleaning messy group datasets, summarising case details with lookups and PivotTables, assembling a budget vs actual model, stress-testing assumptions, preparing slide graphics, and applying AI prompts with verification checks.
Taught by Sagnik Bhattacharya and Virginia Thorn

What you will be able to do
At work, you will be able to:
- Summarise case studies across regions, products, or dates with SUMIFS, slicers, and PivotTables, and link datasets using XLOOKUP or INDEX and MATCH.
- Assemble a budget against actuals model via dynamic arrays and SUMIFS, clarifying variances through combo charts and custom number formatting.
- Keep model assumptions separate from calculation logic to test stricter projections, following the WealthFlow method for returns and inflation.
- Select and format presentation-ready charts for business discussions, covering column, line, combo, waterfall, and Pareto layouts.
- Clean messy data for team assignments using Excel Tables, TRIM, Remove Duplicates, and Text to Columns, pulling distinct entries with UNIQUE.
- Plan and accelerate analysis using Claude, ChatGPT, and Copilot, checking generated figures against a quality assurance checklist.
Projects
What you will build.
The course has 14 projects. These five matter most here.
-
Project 05
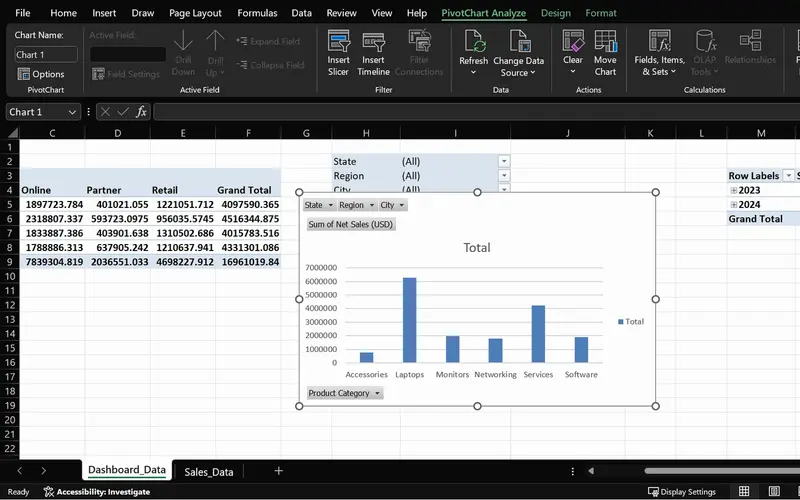
SalesPlusPerformance
A sales question answered in seconds, straight from the order data.
Filter and segment sales records by date, region, and product using slicers and date grouping, preparing clear exhibits for class discussion.
-
Project 09
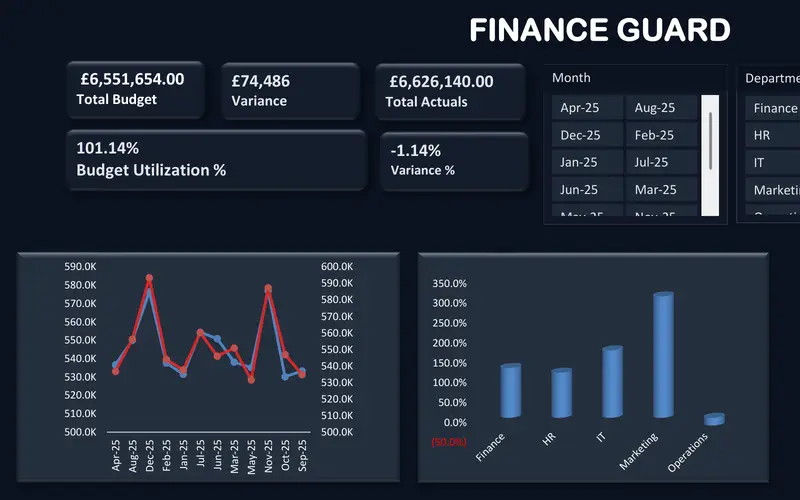
FinanceGuard
The budget vs actual report finance teams send every month.
Track performance against targets using dynamic arrays and SUMIFS, computing variances and percentage variances for an interactive reporting dashboard.
-
Project 10
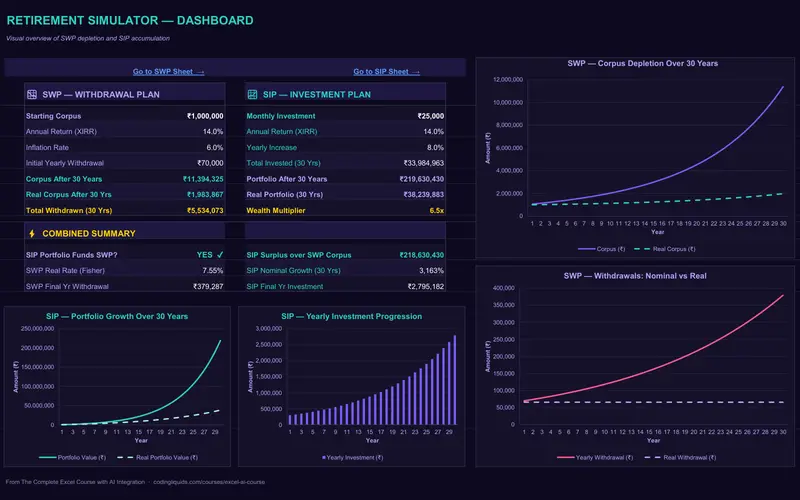
WealthFlow
A retirement plan that shows how long the money lasts.
Separate core assumptions from calculation cells to rerun the model under adverse conditions, building the habit of testing inputs for case studies.
-
Project 04
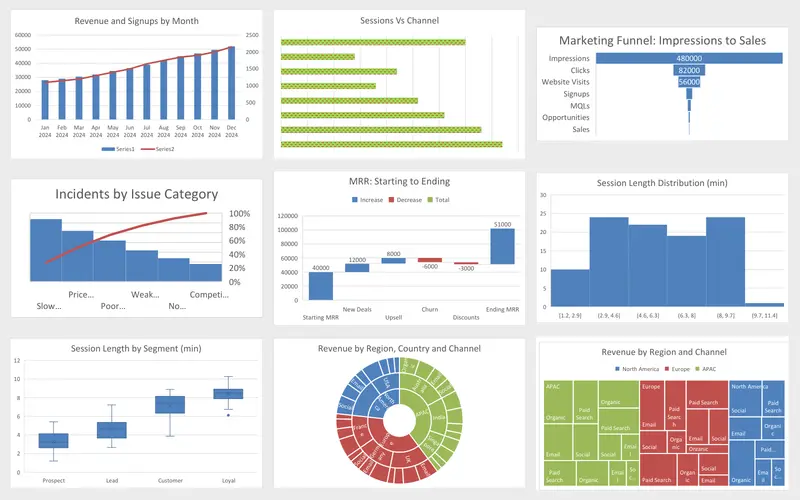
Marketing Engagement Dashboard
Nine charts, each picked for the question it answers.
Create slide-ready graphics using marketing metrics, including combo charts for paired measures and waterfall bridges for period changes.
-
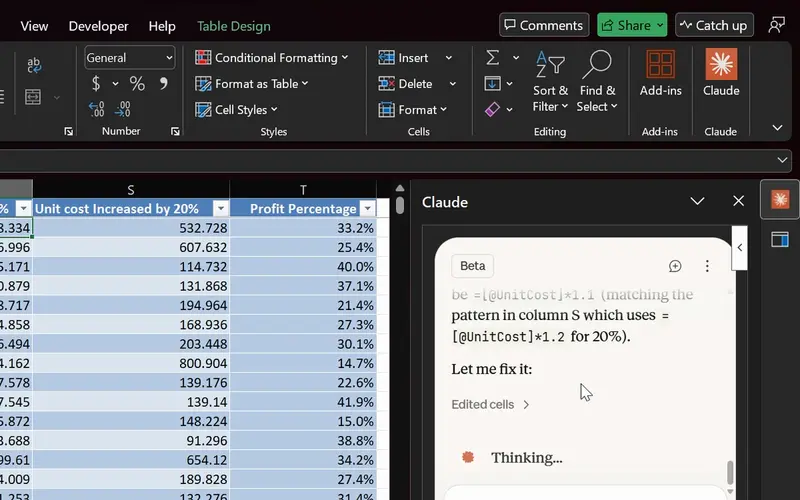
Project 14
Agentic AI in Excel
AI finds and fixes the formula; you check it before it counts.
Use Copilot, ChatGPT, and Claude to outline and execute workbook tasks, applying a QA checklist so unverified numbers never reach presentations.
Lessons
The lessons that matter, in course order.
The Complete Excel Course with AI Integration has 186 lessons. This page picks out 76 of them, 6 h 26 min of video. Each lesson keeps its number in the course.
Where to start
Lesson 19 Excel tables
Start at Lesson 19 if you already know how to enter data and write basic formulas, since structured data must precede analysis. That section, Managing data in Excel, is free by email with its practice files when requested on the course page. Beginners can start at Lesson 1. If you already know PivotTables and lookups, proceed to Lesson 115 to build the budget model, or move to Lesson 88 for the AI lessons.
76 of 186 lessons · 6 h 26 min
03 Managing data in Excel: sort, filter and tables (Dunder Michael Paper employee database) Prepare group project data using Excel Tables, sorting, filtering, TRIM, Find and Replace, Remove Duplicates, Flash Fill, Text to Columns, freeze panes, and print layout controls, working on an employee database.
- 19 Start here Excel tables Create and format a table, structured references and total row 8 min
- 20 Sorting data in Excel Single and multi-level sort on an employee database 6 min
- 21 Filtering data in Excel AutoFilter, text and number filters on employee data 10 min
- 22 Cleaning data in Excel TRIM, Paste Special values and Find and Replace 13 min
- 23 Remove duplicates in Excel Find and delete duplicate rows in an employee list 6 min
- 24 Flash Fill in Excel Split first and last names automatically 3 min
- 25 Text to Columns in Excel Split data by delimiter into separate columns 6 min
- 26 Freeze panes in Excel Lock header rows and columns while scrolling 3 min
- 27 Printing in Excel Print area, page orientation, scaling and page layout 6 min
04 Essential formulas and functions (IF, SUMIF and more) Answer conditional case questions quickly with SUMIF, COUNTIF, SUMIFS, and COUNTIFS, such as calculating regional revenue within a defined date range.
- 36 SUMIF and COUNTIF in Excel Conditional sum and count with one criterion 8 min
- 37 SUMIFS and COUNTIFS in Excel Sum and count with multiple criteria 7 min
06 Data visualisation: charts and graphs Design and format visuals for presentations using marketing records, matching questions to column, line, pie, combo, sparkline, waterfall, Pareto, histogram, and treemap formats.
- 48 Choosing the right Excel chart Column, line, pie, combo and modern chart types 4 min
- 49 Column charts in Excel Insert, format and label a column chart 5 min
- 50 Line charts in Excel Show trends over time with a line chart 4 min
- 51 Pie charts in Excel Show proportions and parts of a whole 4 min
- 52 Combo charts in Excel Column and line chart with a secondary axis 4 min
- 53 Formatting charts in Excel Titles, data labels, colours and chart styles 7 min
- 54 Sparklines in Excel Line, column and win-loss mini charts in cells 5 min
- 55 Funnel, Pareto and waterfall charts in Excel Modern charts for business data 5 min
- 56 Histogram, box and whisker, treemap and sunburst Advanced Excel chart types 6 min
07 PivotTables and PivotCharts: data analysis made easy Clean, build, and arrange PivotTables and PivotCharts with slicers, date grouping, and data refreshes, concluding with a challenge analysing sales by category, region, and month.
- 57 PivotTables 101 in Excel What a PivotTable does and the sales dataset 5 min
- 58 Preparing data for PivotTables Clean data with TRIM, PROPER, find and replace 5 min
- 59 Create your first PivotTable in Excel Insert a PivotTable from a sales table 1 min
- 60 PivotTable fields in Excel Rows, values, columns and Value Field Settings 2 min
- 61 PivotTable summaries in Excel Sales by product category and grouping by date 4 min
- 62 Slicers in Excel Filter PivotTables with clickable buttons 3 min
- 63 PivotCharts in Excel Create interactive charts from a PivotTable 5 min
- 64 PivotTable design Tab Report layouts, PivotTable styles and number formats 5 min
- 65 Refresh a PivotTable in Excel Update pivots when source data changes 2 min
- 66 Excel Ninja Challenge PivotTable sales by region, category and monthly trend 1 min
08 Advanced Excel functions: lookups, text and arrays Merge separate case tables such as customer and order datasets using VLOOKUP, XLOOKUP, IFERROR, and INDEX and MATCH, practised on HR records.
- 67 Lookup functions in Excel The PeopleInsight HR dataset and why lookups matter 2 min
- 68 VLOOKUP in Excel Find employee data across sheets with exact match 4 min
- 69 XLOOKUP in Excel Exact match, if not found and two-way lookup 6 min
- 70 IFERROR in Excel Handle lookup errors in VLOOKUP and XLOOKUP formulas 3 min
- 71 INDEX and MATCH in Excel A flexible alternative to VLOOKUP 6 min
08 Advanced Excel functions: lookups, text and arrays Extract self-updating lists of distinct clients, filtered segments, and ranked items using modern dynamic array functions like UNIQUE, FILTER, SORT, and SORTBY.
- 75 UNIQUE function in Excel Extract a distinct list with dynamic arrays 6 min
- 76 FILTER function in Excel Dynamic array filtering with AND and OR criteria 5 min
- 77 SORT and SORTBY in Excel Sort data dynamically with formulas 4 min
10 Boosting productivity with AI in Excel (Copilot, ChatGPT and Claude) Apply AI to sales analysis with Claude, Copilot, and ChatGPT, covering what these tools can and cannot do, prompts, data preparation, formulas, PivotTables and charts from AI that you verify, outlier detection, a mini dashboard, the COPILOT function, ChatGPT planning an analysis, Claude analysing data inside Excel, and a QA checklist.
- 88 AI in Excel What Copilot, ChatGPT and Claude can and cannot do 8 min
- 89 Prepare data for Copilot in Excel Tables, headers and clean structure 6 min
- 90 Copilot executive summary in Excel Summarise a dataset in seconds with AI 5 min
- 91 Copilot prompts for Excel Weak vs strong prompts and the PRO prompt pattern 5 min
- 92 PivotTables with Copilot Build an Excel PivotTable from a prompt 5 min
- 93 Charts with Copilot and ChatGPT Create and choose the right Excel chart 6 min
- 94 Conditional formatting with Copilot and ChatGPT Highlight problems in Excel 4 min
- 95 Excel formulas with AI Copilot and ChatGPT write formula columns you verify 6 min
- 96 Find outliers with Copilot in Excel Discounts, negative profit, suspect rows 7 min
- 97 Clean messy data with Copilot in Excel AI prompts plus Excel functions 4 min
- 98 Mini dashboard with Copilot in Excel KPIs, charts and slicers on one page 3 min
- 99 Check AI output in Excel A quick QA checklist for Copilot results 2 min
- 100 ChatGPT as your analysis planner Plan an Excel analysis before you build it 3 min
- 101 COPILOT function in Excel Use Copilot as a formula inside your cells 4 min
- 102 Copilot guided help in Excel Step-by-step AI help inside Excel 3 min
- 103 Microsoft Stride for Excel The Office Agent that builds workbooks for you 4 min
- 104 Claude in Excel Analyse data and build spreadsheets with Claude 7 min
12 Project: FinanceGuard budget variance analyser (budget vs actual Excel dashboard) Construct the FinanceGuard budget vs actual dashboard using SUMIFS, UNIQUE, VSTACK, LET, and TEXTSPLIT, complete with custom number formats, variance calculations, PivotTables, slicers, KPI cards, and combo charts.
- 115 FinanceGuard budget vs actual dashboard Excel project overview 3 min
- 116 Excel tables for budget and actual data Organise the FinanceGuard datasets 4 min
- 117 Budget vs actual model in Excel SORT, UNIQUE, VSTACK, LET, TEXTSPLIT, SUMIFS 8 min
- 118 Budget variance in Excel Calculate variance and percent variance 4 min
- 119 Custom number formats in Excel Show budget variances with colours and signs 2 min
- 120 PivotTables for budget vs actual The FinanceGuard pivot workspace 8 min
- 121 KPI cards in Excel Summary cards for a budget variance dashboard 4 min
- 122 Budget vs actual charts in Excel Combo chart with secondary axis for variance 5 min
- 123 Slicers and PivotCharts in Excel Interactive FinanceGuard budget dashboard 4 min
- 124 Finish the FinanceGuard dashboard in Excel Final polish and variance insights 10 min
13 WealthFlow investment and retirement simulator Build the WealthFlow retirement simulator with separate assumption inputs, real-value inflation adjustments, FV, XIRR, and withdrawal stress tests, establishing modelling habits suited for case analysis.
- 125 SIP and SWP calculators What is an SIP, lump sum and compounding 6 min
- 126 SIP and SWP calculators What is an SWP, inflation and FIRE 6 min
- 127 WealthFlow SIP model in Excel Input assumptions, XIRR and monthly rate 6 min
- 128 WealthFlow SIP model in Excel Step-up SIP table and FV formulas 6 min
- 129 WealthFlow SIP model in Excel Real portfolio value, inflation and charts 7 min
- 130 WealthFlow SWP model in Excel Real rate, corpus and yearly withdrawals 6 min
- 131 WealthFlow SWP model in Excel Real corpus, stress test and SWP chart 5 min
- 132 Retirement simulator in Excel WealthFlow inputs, year and age columns 5 min
- 133 Retirement simulator in Excel SIP, withdrawal and portfolio formulas with IF 7 min
- 134 Retirement simulator in Excel Reading the results and retirement scenarios 5 min
- 135 Retirement simulator in Excel Claude builds the WealthFlow dashboard 5 min
Instructors
Who teaches it.

Instructor, Excel with AI
Virginia Thorn
Emmy Award winner. Teaches Excel with AI at Coding Liquids.
Questions
Asked before starting.
What Excel course should MBA students, pre-MBA learners, and business students take?
The Complete Excel Course with AI Integration from Coding Liquids delivers the spreadsheet training business programmes rely on: PivotTables, SUMIFS, and lookups for case data, a budget vs actual model, a model rerun under tougher assumptions, presentation charts, and Copilot, ChatGPT, and Claude paired with a QA checklist. The 76 lessons featured here require 6 hours 26 minutes of the course's 16 hours, with entry lessons available for those starting from scratch.
Does the course teach corporate finance or valuation to MBA and business students?
No. The Complete Excel Course with AI Integration concentrates on Excel functionality rather than financial theory: corporate finance, valuation techniques like discounted cash flow, PowerPoint, and statistics are not taught. It provides the spreadsheet foundation those subjects demand: data cleaning, lookup formulas, PivotTables, budget against actual modelling, and structures that separate assumptions from calculations.
Can MBA and business students test scenarios and assumptions in Excel with this course?
Yes, using the modelling approach taught through WealthFlow in The Complete Excel Course with AI Integration: assumptions sit in dedicated cells that feed formulas, so adjusting an input like inflation or returns reruns the model under tougher scenarios. While taught using a personal investment plan, the method translates directly to testing cost and revenue assumptions in business cases.
Will AI tools help MBA and business students with case analysis?
AI tools can speed up your work when properly checked. The Complete Excel Course with AI Integration demonstrates using ChatGPT to plan an analysis, Copilot to create formula columns, PivotTables, and charts from prompts, and Claude to examine data within Excel, alongside a QA checklist to verify figures before presenting them. Coursework policies regarding AI use at your business school are not covered.
Excel with AI
See the whole course.
The Complete Excel Course with AI Integration: 16 hours of video in 186 lessons, built around 14 projects, with lifetime access, a Certificate of Completion and a 14-day money-back guarantee.
The same course
For another job, level or topic.
By job
Finance and accounting
- Accountants and finance teams
- Bookkeepers and accounts assistants
- FP&A and budget analysts
- Auditors and fraud examiners
- Payroll administrators
- Tax accountants and advisers
- Banking professionals
- Cost and management accountants
- Financial controllers
- Credit control and receivables teams
- Accounts payable teams
- Financial planners and advisers
- Credit analysts and loan officers
- Insurance underwriters
- Insurance claims handlers
- Reconciliation analysts
- Treasury analysts
- Medical billing and coding specialists
- Fund accountants
- Billing administrators
- AML and KYC analysts
- Actuarial analysts
- Insurance agents and brokers
HR and office administration
Operations and supply chain
- Operations and project managers
- Procurement and purchasing officers
- Logistics coordinators
- Inventory controllers and storekeepers
- Supply chain analysts
- Warehouse managers and supervisors
- PMO analysts
- Import and export coordinators
- Production planners
- Demand planners
- Fleet and transport managers
- Apparel merchandisers
Data and reporting
Sales, marketing and customer service
Business and management
Engineering, construction and manufacturing
- Quantity surveyors and estimators
- Civil and site engineers
- Quality managers and engineers
- Construction project managers
- Health and safety officers
- Document controllers
- Production managers and supervisors
- Mechanical and electrical engineers
- Industrial engineers
- Planning engineers
- Sustainability and ESG analysts
- Maintenance planners