



The Complete Excel Course with AI Integration
Excel course for FP&A and budget analysts
For FP&A analysts and budget analysts who build the budget, set it against actuals each month and explain the gap. This page picks out the planning and reporting side of The Complete Excel Course with AI Integration: the charts a monthly pack is made of, the dynamic arrays and SUMIFS behind the FinanceGuard model, an assumptions-driven model tested under tougher inputs, and Power Query with DAX for consolidation.
Taught by Sagnik Bhattacharya and Virginia Thorn

What you will be able to do
At work, you will be able to:
- Build a budget vs actual model from a budget table and an actuals table with SUMIFS, UNIQUE, VSTACK and LET, so the model recalculates when a new month's actuals are added.
- Explain the gap between budget and actual with a waterfall chart, and the trend across the months with a combo chart on two axes.
- Sign and colour each variance and percent variance with a custom number format, and sum up the month in KPI cards beside slicers.
- Consolidate several months or entities into one table with Power Query, appending queries and combining a whole folder of exports.
- Relate monthly fact tables to their lookup tables in a Power Pivot data model, and report margin percent and percent of total with DAX measures.
- Keep assumptions apart from formulas in a model built with FV, XIRR and IF, and rerun it under tougher inputs to see how far the result moves.
Projects
What you will build.
The course has 14 projects. These four matter most here.
-
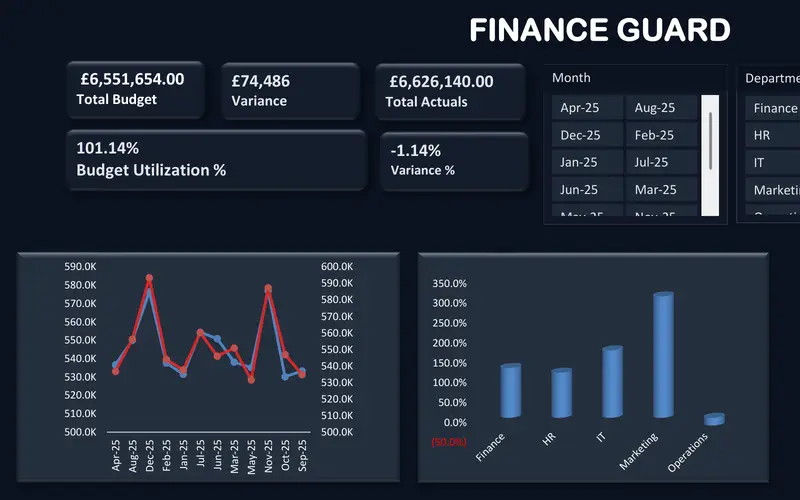
Project 09
FinanceGuard
The budget vs actual report finance teams send every month.
Your monthly variance review as a working model: budget and actuals side by side, each variance signed and coloured by a number format, and slicers for month, department and category.
-
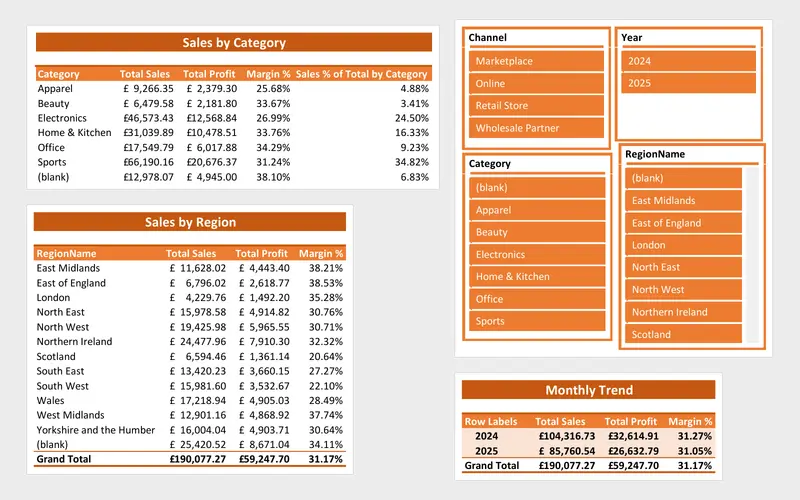
Project 12
SalesFusion
A sales report that refreshes itself from a folder of files.
Several months or entities in one model: Power Query stacks the exports, Power Pivot relates the tables, and DAX measures give margin percent and percent of total.
-
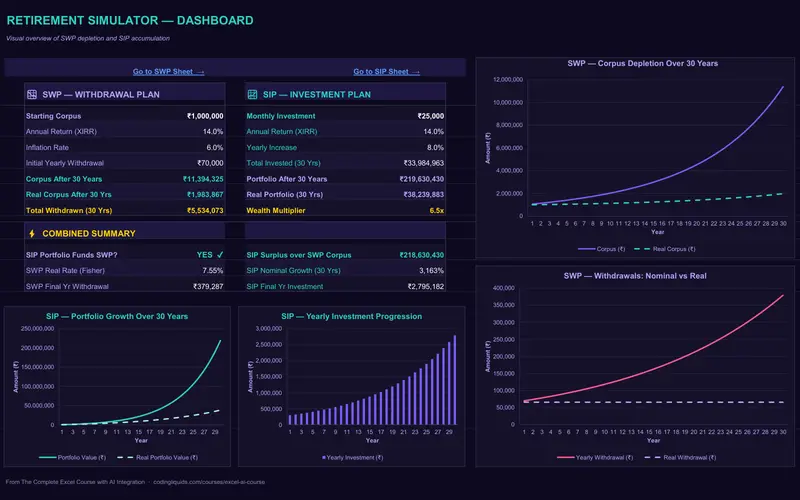
Project 10
WealthFlow
A retirement plan that shows how long the money lasts.
A personal investment plan, studied for its method: input assumptions set apart from the formulas, contributions that step up each year, values after inflation, and the plan rerun under harsher assumptions.
-
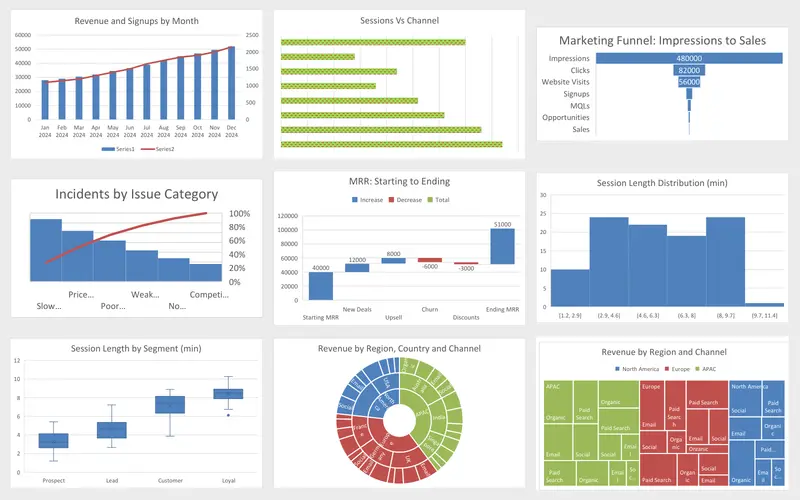
Project 04
Marketing Engagement Dashboard
Nine charts, each picked for the question it answers.
Chart choice for a finance pack, practised on marketing data: a line for a trend, a combo on two axes for actual against plan, and a waterfall for the walk from budget to actual.
Lessons
The lessons that matter, in course order.
The Complete Excel Course with AI Integration has 186 lessons. This page picks out 54 of them, 5 h 4 min of video. Each lesson keeps its number in the course.
Where to start
Lesson 48 Choosing the right Excel chart
Begin at Lesson 48 if SUMIFS and PivotTables are already part of your week: the path opens with the charts a monthly pack needs, then the dynamic arrays the FinanceGuard model uses. If those two are new, take Lesson 36 and the PivotTable lessons from Lesson 57 first. New to Excel? Begin at Lesson 1. If charts and dynamic arrays are familiar, go straight to Lesson 115.
54 of 186 lessons · 5 h 4 min
06 Data visualisation: charts and graphs The charts of a monthly pack: which chart answers which question, column and line charts for comparisons and trends, combo charts with a secondary axis, sparklines beside a row of monthly figures, and the waterfall chart for a budget to actual bridge. The lessons chart marketing data.
- 48 Start here Choosing the right Excel chart Column, line, pie, combo and modern chart types 4 min
- 49 Column charts in Excel Insert, format and label a column chart 5 min
- 50 Line charts in Excel Show trends over time with a line chart 4 min
- 51 Pie charts in Excel Show proportions and parts of a whole 4 min
- 52 Combo charts in Excel Column and line chart with a secondary axis 4 min
- 53 Formatting charts in Excel Titles, data labels, colours and chart styles 7 min
- 54 Sparklines in Excel Line, column and win-loss mini charts in cells 5 min
- 55 Funnel, Pareto and waterfall charts in Excel Modern charts for business data 5 min
- 56 Histogram, box and whisker, treemap and sunburst Advanced Excel chart types 6 min
08 Advanced Excel functions: lookups, text and arrays UNIQUE, FILTER and SORT, dynamic array functions of the kind the FinanceGuard model is written with, so the list of budget lines updates when the data does.
- 75 UNIQUE function in Excel Extract a distinct list with dynamic arrays 6 min
- 76 FILTER function in Excel Dynamic array filtering with AND and OR criteria 5 min
- 77 SORT and SORTBY in Excel Sort data dynamically with formulas 4 min
12 Project: FinanceGuard budget variance analyser (budget vs actual Excel dashboard) FinanceGuard end to end: budget and actuals as tables, a model in SUMIFS, UNIQUE, VSTACK, LET and TEXTSPLIT, variance and percent variance, a pivot workspace, KPI cards, a combo chart of the monthly trend and slicers.
- 115 FinanceGuard budget vs actual dashboard Excel project overview 3 min
- 116 Excel tables for budget and actual data Organise the FinanceGuard datasets 4 min
- 117 Budget vs actual model in Excel SORT, UNIQUE, VSTACK, LET, TEXTSPLIT, SUMIFS 8 min
- 118 Budget variance in Excel Calculate variance and percent variance 4 min
- 119 Custom number formats in Excel Show budget variances with colours and signs 2 min
- 120 PivotTables for budget vs actual The FinanceGuard pivot workspace 8 min
- 121 KPI cards in Excel Summary cards for a budget variance dashboard 4 min
- 122 Budget vs actual charts in Excel Combo chart with secondary axis for variance 5 min
- 123 Slicers and PivotCharts in Excel Interactive FinanceGuard budget dashboard 4 min
- 124 Finish the FinanceGuard dashboard in Excel Final polish and variance insights 10 min
13 WealthFlow investment and retirement simulator WealthFlow: monthly investing that steps up each year, withdrawals, inflation and real values, modelled with FV, XIRR and IF from input assumptions kept apart from the formulas, then rerun under tougher scenarios. The plan is a personal one; the way the model is built carries over to planning work.
- 125 SIP and SWP calculators What is an SIP, lump sum and compounding 6 min
- 126 SIP and SWP calculators What is an SWP, inflation and FIRE 6 min
- 127 WealthFlow SIP model in Excel Input assumptions, XIRR and monthly rate 6 min
- 128 WealthFlow SIP model in Excel Step-up SIP table and FV formulas 6 min
- 129 WealthFlow SIP model in Excel Real portfolio value, inflation and charts 7 min
- 130 WealthFlow SWP model in Excel Real rate, corpus and yearly withdrawals 6 min
- 131 WealthFlow SWP model in Excel Real corpus, stress test and SWP chart 5 min
- 132 Retirement simulator in Excel WealthFlow inputs, year and age columns 5 min
- 133 Retirement simulator in Excel SIP, withdrawal and portfolio formulas with IF 7 min
- 134 Retirement simulator in Excel Reading the results and retirement scenarios 5 min
- 135 Retirement simulator in Excel Claude builds the WealthFlow dashboard 5 min
15 SalesFusion: advanced data tools and a Power Query modelling system SalesFusion: Power Query combines a folder of sales files, appends one year to the next, merges lookup tables and unpivots wide month columns into a long table; Power Pivot relates the tables and DAX measures give margin percent and percent of total. The Power Pivot lessons need Excel for Windows.
- 153 SalesFusion Power Query project Excel ETL pipeline and data model overview 5 min
- 154 Introduction to Power Query in Excel The ETL workflow explained 5 min
- 155 Import a CSV with Power Query Get data from text and transform data 2 min
- 156 Clean columns in Power Query Remove and rename columns for modelling 5 min
- 157 Clean text in Power Query Trim, clean, replace values and fix text case 6 min
- 158 Data types in Power Query Fix date, whole number, decimal and text types 7 min
- 159 Date columns in Power Query Add year, month and year-month fields for reports 7 min
- 160 Business logic in Power Query Custom and conditional columns for profitability 6 min
- 161 Group By in Power Query Summarise sales by month and region to validate data 5 min
- 162 Close and Load in Power Query Connection only, table or Data Model 5 min
- 163 Merge queries in Power Query Look up product and region names with a left join 5 min
- 164 Reuse a Power Query pipeline Duplicate queries for a new year of sales data 5 min
- 165 Append queries in Power Query Combine 2024 and 2025 sales tables 3 min
- 166 From Folder in Power Query Combine every sales file in a folder automatically 9 min
- 167 From Folder automation in Power Query Profit metrics and fiscal year columns 7 min
- 168 Build a sales fact table in Power Query Merge lookups and append history 6 min
- 169 Power Pivot Data Model in Excel Relationships and Diagram View 6 min
- 170 DAX measures in Power Pivot Total sales, margin percent and percent of total 10 min
- 171 PivotTable report from the Data Model Format the SalesFusion report in Excel 5 min
- 172 Interactive Excel dashboard Data model PivotTables, slicers and styling 10 min
- 173 Unpivot columns in Power Query Turn wide month columns into a long table 8 min
Instructors
Who teaches it.

Instructor, Excel with AI
Virginia Thorn
Emmy Award winner. Teaches Excel with AI at Coding Liquids.
Questions
Asked before starting.
Is there an Excel course for FP&A analysts?
Yes. The Complete Excel Course with AI Integration from Coding Liquids covers the Excel side of planning and analysis: FinanceGuard, a budget vs actual model and dashboard written with dynamic arrays; waterfall and combo charts for the monthly pack; SalesFusion for consolidating files in Power Query and measuring in DAX; and WealthFlow, a model tested under tougher inputs. The 54 lessons here come to 5 hours 4 minutes of the course's 16 hours.
Does it teach forecasting or three-statement models?
No. The Complete Excel Course with AI Integration has no lessons on forecasting methods, driver-based rolling forecasts, three-statement models or discounted cash flow, and it does not teach planning software. What it gives an FP&A analyst is the Excel work around them: a budget vs actual model, variance charts, consolidation in Power Query and DAX measures on a data model.
Can I build a waterfall chart for budget variance in Excel?
Yes. The charts section of The Complete Excel Course with AI Integration has a lesson on funnel, Pareto and waterfall charts, next to combo charts with a secondary axis and sparklines. Those lessons chart marketing data; a bridge from budget to actual is the same waterfall chart fed with the variances that FinanceGuard calculates.
Can Power Query consolidate monthly or entity files?
Yes. In the SalesFusion project of The Complete Excel Course with AI Integration, Power Query imports CSV files, cleans them, appends one period to another and combines a whole folder at once, so the next file placed in the folder is picked up on refresh. The lessons use sales files; the Power Pivot data model and DAX measures that follow need Excel for Windows.
Why is a retirement model on a path for budget analysts?
For its method, not its subject. WealthFlow in The Complete Excel Course with AI Integration sets its input assumptions apart from the formulas, grows contributions with a yearly step-up, turns values into today's money after inflation, and reruns the plan under tougher inputs. Those are the habits of a planning model; personal finance is only the setting.
Excel with AI
See the whole course.
The Complete Excel Course with AI Integration: 16 hours of video in 186 lessons, built around 14 projects, with lifetime access, a Certificate of Completion and a 14-day money-back guarantee.
The same course
For another job, level or topic.
By job
Finance and accounting
- Accountants and finance teams
- Bookkeepers and accounts assistants
- Auditors and fraud examiners
- Payroll administrators
- Tax accountants and advisers
- Banking professionals
- Cost and management accountants
- Financial controllers
- Credit control and receivables teams
- Accounts payable teams
- Financial planners and advisers
- Credit analysts and loan officers
- Insurance underwriters
- Insurance claims handlers
- Reconciliation analysts
- Treasury analysts
- Medical billing and coding specialists
- Fund accountants
- Billing administrators
- AML and KYC analysts
- Actuarial analysts
- Insurance agents and brokers
HR and office administration
Operations and supply chain
- Operations and project managers
- Procurement and purchasing officers
- Logistics coordinators
- Inventory controllers and storekeepers
- Supply chain analysts
- Warehouse managers and supervisors
- PMO analysts
- Import and export coordinators
- Production planners
- Demand planners
- Fleet and transport managers
- Apparel merchandisers
Data and reporting
Sales, marketing and customer service
Business and management
Engineering, construction and manufacturing
- Quantity surveyors and estimators
- Civil and site engineers
- Quality managers and engineers
- Construction project managers
- Health and safety officers
- Document controllers
- Production managers and supervisors
- Mechanical and electrical engineers
- Industrial engineers
- Planning engineers
- Sustainability and ESG analysts
- Maintenance planners