



The Complete Excel Course with AI Integration
Excel course for recruiters
Recruiters, talent acquisition teams and recruitment coordinators can use this guide to The Complete Excel Course with AI Integration for candidate tracking and hiring reports in Excel. It picks out course material to apply to cleaning candidate lists and removing duplicates, stage drop-downs, time to hire using date arithmetic, source of hire with COUNTIFS and PivotTables, funnel charts, interview feedback tracking and dashboards for hiring managers.
Taught by Sagnik Bhattacharya and Virginia Thorn

What you will be able to do
At work, you will be able to:
- Organise your candidate pipeline in an Excel Table, using role or stage to sort and filter it and drop-downs to enter stage and status.
- Clean names, email addresses and phone numbers using TRIM, PROPER and SUBSTITUTE, and remove repeated candidate records.
- Calculate how long hiring takes and how many days candidates spend at each stage using date arithmetic, TODAY and NETWORKDAYS.
- Use a funnel chart to reveal candidate drop-off, with COUNTIFS and PivotTables to count candidates by source, role and stage.
- Share an interview feedback tracker with hiring managers and use conditional formatting to highlight overdue responses.
- Build a hiring manager dashboard that presents conversion rates and KPI cards, with slicers for selecting roles and teams.
Projects
What you will build.
The course has 14 projects. These four matter most here.
-
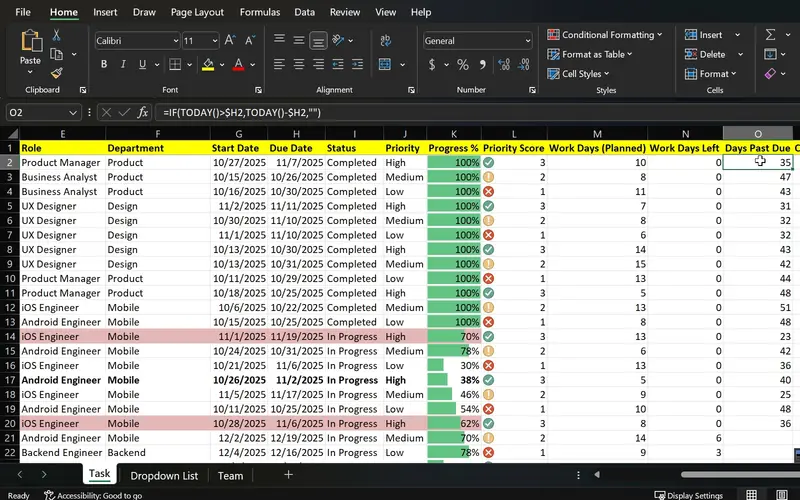
Project 07
TaskFlow
One sheet that shows what is done, what is late and what is urgent.
Apply dates to interviews and feedback, select candidate statuses from a drop-down and colour feedback that is late. Calculate the working days remaining until an offer deadline.
-
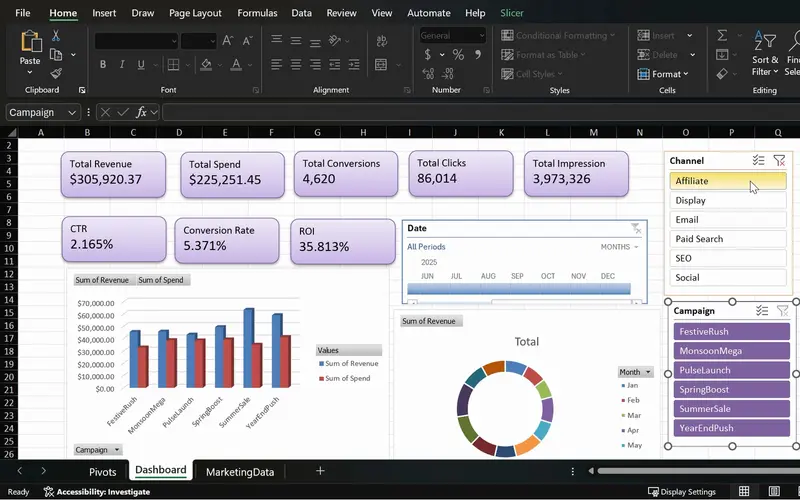
Project 08
MarketPulse
One screen that shows which campaigns earn back their spend.
Translate the campaign report into hiring terms: replace campaigns with sources of hire and click-through with conversion between stages, then filter by role and team using slicers.
-
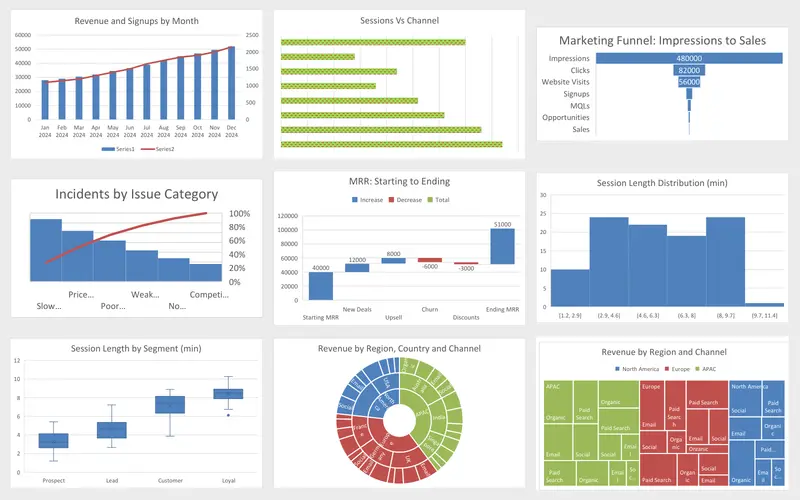
Project 04
Marketing Engagement Dashboard
Nine charts, each picked for the question it answers.
Learn the funnel chart here and apply its shape to recruitment, showing the number of candidates remaining at successive hiring stages.
-
Project 02
Dunder Michael Paper Company employee database
Practise preparing candidate data through an employee database: trim and split names, filter to a particular role and remove duplicates to avoid contacting the same person twice.
Lessons
The lessons that matter, in course order.
The Complete Excel Course with AI Integration has 186 lessons. This page picks out 50 of them, 4 h 18 min of video. Each lesson keeps its number in the course.
Where to start
Lesson 19 Excel tables
If you already manage candidate lists in Excel, start with Lesson 19; if you are new to Excel, start with Lesson 1. For reporting from lists that are already clean, begin the PivotTable lessons at Lesson 57, then continue to MarketPulse. This path includes the whole opening section, Managing data in Excel, available free by email with its practice files. Request it on the course page.
50 of 186 lessons · 4 h 18 min
03 Managing data in Excel: sort, filter and tables (Dunder Michael Paper employee database) Organise candidate records with Excel Tables and sort or filter them by role or stage. Clean entries with TRIM and Find and Replace, remove repeat applications with Remove Duplicates, and split names with Flash Fill and Text to Columns. Freeze Panes and printing complete this work on candidate lists.
- 19 Start here Excel tables Create and format a table, structured references and total row 8 min
- 20 Sorting data in Excel Single and multi-level sort on an employee database 6 min
- 21 Filtering data in Excel AutoFilter, text and number filters on employee data 10 min
- 22 Cleaning data in Excel TRIM, Paste Special values and Find and Replace 13 min
- 23 Remove duplicates in Excel Find and delete duplicate rows in an employee list 6 min
- 24 Flash Fill in Excel Split first and last names automatically 3 min
- 25 Text to Columns in Excel Split data by delimiter into separate columns 6 min
- 26 Freeze panes in Excel Lock header rows and columns while scrolling 3 min
- 27 Printing in Excel Print area, page orientation, scaling and page layout 6 min
04 Essential formulas and functions (IF, SUMIF and more) Measure time to hire and time spent in a stage through date arithmetic and TODAY. Use COUNTIF and COUNTIFS for candidate counts by role and stage, alongside SUMIFS for totals.
- 36 SUMIF and COUNTIF in Excel Conditional sum and count with one criterion 8 min
- 37 SUMIFS and COUNTIFS in Excel Sum and count with multiple criteria 7 min
- 38 The Excel function library Insert Function dialog and Formula AutoComplete 5 min
- 39 Date and time functions in Excel TODAY, NOW, MONTH and date arithmetic 6 min
05 Text functions and data validation (enhancing data quality) Keep stage entries consistent with drop-down lists and tidy candidate contact details with text functions. TRIM and PROPER clean names, SUBSTITUTE removes unwanted phone-number characters, and FIND and SEARCH locate text within email addresses.
- 41 CONCAT, the & operator and TEXTJOIN in Excel Combine text from multiple cells 6 min
- 42 TRIM, UPPER, LOWER and PROPER in Excel Clean messy text and fix capitalisation 6 min
- 43 FIND, SEARCH and SUBSTITUTE in Excel Locate and replace text with formulas 5 min
- 44 Text to Columns wizard in Excel Split a column by a comma delimiter 4 min
- 45 Data validation in Excel Create drop-down lists for consistent data entry 4 min
- 46 Ninja Challenge: problem Clean messy data with text functions and validation 4 min
- 47 Ninja Challenge: solution PROPER, Text to Columns and drop-down lists 7 min
06 Data visualisation: charts and graphs Explore business data through Pareto, waterfall and funnel charts. For recruitment, the funnel shows the candidates still in the process at each stage between application and offer.
- 55 Funnel, Pareto and waterfall charts in Excel Modern charts for business data 5 min
07 PivotTables and PivotCharts: data analysis made easy Analyse source of hire, stage counts and monthly hires using PivotTables, PivotCharts and slicers. These lessons work with sales records, but the approach also applies to an applicant export.
- 57 PivotTables 101 in Excel What a PivotTable does and the sales dataset 5 min
- 58 Preparing data for PivotTables Clean data with TRIM, PROPER, find and replace 5 min
- 59 Create your first PivotTable in Excel Insert a PivotTable from a sales table 1 min
- 60 PivotTable fields in Excel Rows, values, columns and Value Field Settings 2 min
- 61 PivotTable summaries in Excel Sales by product category and grouping by date 4 min
- 62 Slicers in Excel Filter PivotTables with clickable buttons 3 min
- 63 PivotCharts in Excel Create interactive charts from a PivotTable 5 min
- 64 PivotTable design Tab Report layouts, PivotTable styles and number formats 5 min
- 65 Refresh a PivotTable in Excel Update pivots when source data changes 2 min
- 66 Excel Ninja Challenge PivotTable sales by region, category and monthly trend 1 min
09 Project: task automation with data validation and forms Adapt the TaskFlow task tracker to interviews: choose status and priority from drop-downs, highlight overdue entries and follow a timeline. NETWORKDAYS and TODAY calculate days remaining, while sheet protection supports sharing the tracker with the team.
- 79 TaskFlow project tracker in Excel Overview of the task tracker dashboard 4 min
- 80 Designing a task tracker in Excel TaskFlow layout, columns and headers 5 min
- 81 Data validation in Excel Status and priority drop-down lists in TaskFlow 8 min
- 82 Conditional formatting in Excel Highlight overdue and completed tasks 8 min
- 83 Gantt chart in Excel Build a project timeline with conditional formatting 6 min
- 84 Data bars and icon sets in Excel Visual priority and progress in TaskFlow 6 min
- 85 NETWORKDAYS and TODAY in Excel Days remaining and task deadlines in TaskFlow 5 min
- 86 Protect a sheet and lock cells in Excel Secure the TaskFlow tracker workbook 4 min
- 87 Testing an Excel task tracker Stress test TaskFlow with sample data 3 min
11 MarketPulse campaign intelligence dashboard Follow MarketPulse from data cleaning and conversion calculations with IFERROR through PivotTables to KPI cards, charts, slicers and a timeline. The project uses campaign records; the same approach supports a hiring funnel organised by source.
- 105 MarketPulse marketing dashboard in Excel Project overview and campaign data 4 min
- 106 Clean and check marketing data in Excel Remove duplicates, Copilot KPI plan 4 min
- 107 Plan a marketing dashboard with ChatGPT KPIs and the PivotTable strategy 4 min
- 108 Marketing PivotTables in Excel Build the MarketPulse pivot back end 6 min
- 109 CTR, conversion rate and ROI in Excel Marketing KPI formulas with IFERROR 4 min
- 110 PivotTables with Copilot Generate and verify marketing pivots in Excel 6 min
- 111 Marketing charts and a timeline in Excel MarketPulse dashboard PivotCharts 4 min
- 112 KPI cards in Excel Marketing KPI cards for the MarketPulse dashboard 7 min
- 113 Slicers for an Excel dashboard Interactive filtering in MarketPulse 4 min
- 114 Polish an Excel marketing dashboard Final formatting and insights in MarketPulse 9 min
Instructors
Who teaches it.

Instructor, Excel with AI
Virginia Thorn
Emmy Award winner. Teaches Excel with AI at Coding Liquids.
Questions
Asked before starting.
Which Excel course covers the work recruiters do?
The Complete Excel Course with AI Integration from Coding Liquids teaches Excel skills recruiters can apply to candidate records and hiring reports. Those uses include cleaning lists and removing duplicates, stage drop-downs, source of hire with COUNTIFS and PivotTables, funnel charts, a tracker for overdue feedback, and dashboards with KPI cards and slicers. The selection on this page comprises 50 lessons, taking 4 hours 18 minutes within the course's 16 hours.
Can recruiters use Excel to work out time to hire and offer acceptance rate?
Yes. The formulas taught in The Complete Excel Course with AI Integration support both calculations. Subtract dates for time to hire, use TODAY for roles that remain open, and use NETWORKDAYS to count only working days. For acceptance or conversion rates, divide one count by another: COUNTIFS supplies the counts, and IFERROR handles an empty stage, as it does for conversion rates in MarketPulse.
Will recruiters learn applicant tracking systems or sourcing on this course?
No. Applicant tracking systems, sourcing techniques and employment law are outside The Complete Excel Course with AI Integration, which teaches Excel rather than recruitment. Its work begins with candidate data exported from your system into a spreadsheet, ready to clean, count, track and report on.
How can recruiters create an Excel dashboard for hiring managers?
Use the approach demonstrated in the MarketPulse marketing campaign dashboard in The Complete Excel Course with AI Integration. Build the supporting PivotTables, calculate rates with IFERROR, present headline figures in KPI cards and add charts. Slicers let hiring managers select a role or team, and a timeline handles dates. The earlier PivotTable lessons included on this page use sales data.
Excel with AI
See the whole course.
The Complete Excel Course with AI Integration: 16 hours of video in 186 lessons, built around 14 projects, with lifetime access, a Certificate of Completion and a 14-day money-back guarantee.
The same course
For another job, level or topic.
By job
Finance and accounting
- Accountants and finance teams
- Bookkeepers and accounts assistants
- FP&A and budget analysts
- Auditors and fraud examiners
- Payroll administrators
- Tax accountants and advisers
- Banking professionals
- Cost and management accountants
- Financial controllers
- Credit control and receivables teams
- Accounts payable teams
- Financial planners and advisers
- Credit analysts and loan officers
- Insurance underwriters
- Insurance claims handlers
- Reconciliation analysts
- Treasury analysts
- Medical billing and coding specialists
- Fund accountants
- Billing administrators
- AML and KYC analysts
- Actuarial analysts
- Insurance agents and brokers
HR and office administration
Operations and supply chain
- Operations and project managers
- Procurement and purchasing officers
- Logistics coordinators
- Inventory controllers and storekeepers
- Supply chain analysts
- Warehouse managers and supervisors
- PMO analysts
- Import and export coordinators
- Production planners
- Demand planners
- Fleet and transport managers
- Apparel merchandisers
Data and reporting
Sales, marketing and customer service
Business and management
Engineering, construction and manufacturing
- Quantity surveyors and estimators
- Civil and site engineers
- Quality managers and engineers
- Construction project managers
- Health and safety officers
- Document controllers
- Production managers and supervisors
- Mechanical and electrical engineers
- Industrial engineers
- Planning engineers
- Sustainability and ESG analysts
- Maintenance planners