



The Complete Excel Course with AI Integration
Excel course for financial controllers
For financial controllers and finance managers who run the month-end close and sign off the reporting pack in Excel. This page picks out the parts of The Complete Excel Course with AI Integration that a controller's month uses: a close tracker, AI for first drafts and checks, the budget vs actual report, consolidation with Power Query and a data model, and desktop flows for steps that repeat.
Taught by Sagnik Bhattacharya and Virginia Thorn

What you will be able to do
At work, you will be able to:
- Run the month-end close from a tracker: tasks with due dates, statuses from drop-down lists, late items highlighted and the working days left with NETWORKDAYS.
- Consolidate ledgers or trial balances from several entities with Power Query appends and From Folder queries, and relate them in a Power Pivot data model.
- Build the budget vs actual page of the monthly pack with variance and percent variance, KPI cards, a combo chart and slicers.
- Highlight unexplained differences in a reconciliation with conditional formatting, written with help from Copilot or ChatGPT.
- Draft variance commentary from Copilot's executive summary, and check each figure it quotes against the data with a QA checklist.
- Hand a repeated close step to a Power Automate Desktop flow that opens Excel, loops through rows and asks for approval with a message box.
Projects
What you will build.
The course has 14 projects. These five matter most here.
-
Project 07
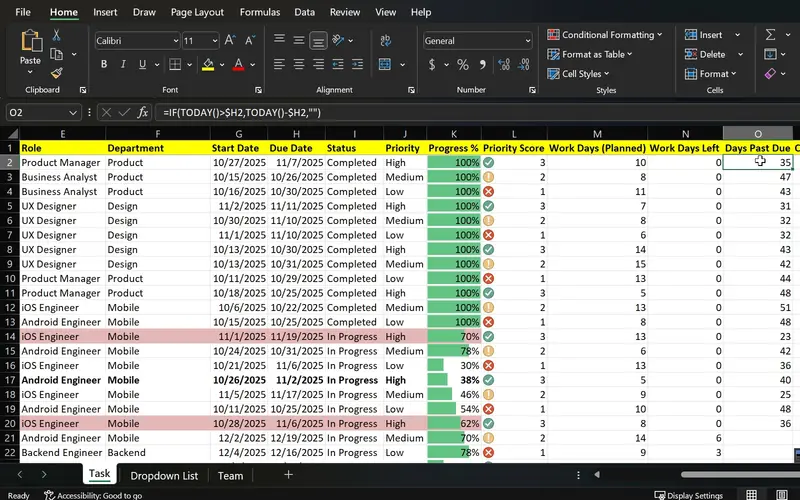
TaskFlow
One sheet that shows what is done, what is late and what is urgent.
Built for tasks, so a close checklist fits it as it stands: each task with a due date, a status and a priority from drop-down lists, late items in colour, a timeline of the close and a sheet locked against accidental edits.
-
Project 09
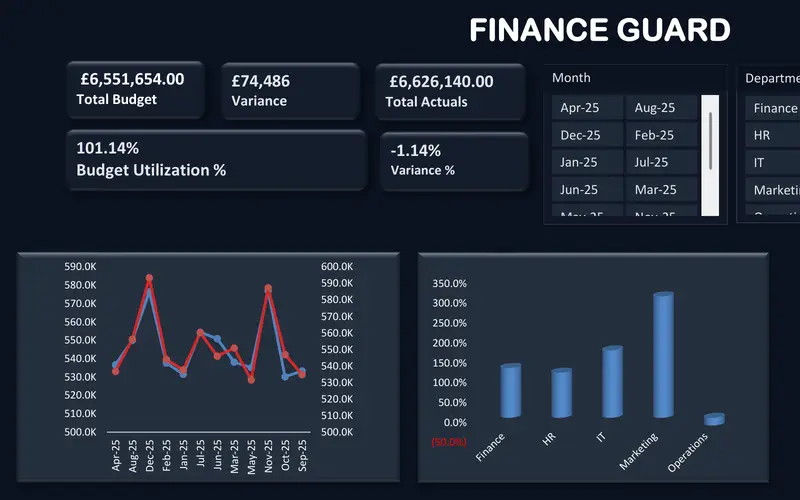
FinanceGuard
The budget vs actual report finance teams send every month.
The reporting pack's centre page: budget against actual for each department and category, variances in money and percent, and filters a director can use without help.
-
Project 12
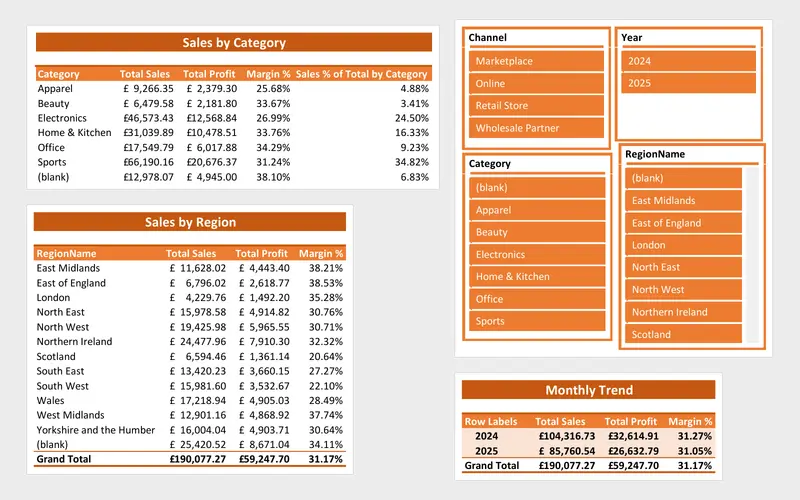
SalesFusion
A sales report that refreshes itself from a folder of files.
A consolidation that starts from a refresh: entity files appended into one table by Power Query, related in Power Pivot and measured with DAX.
-
Project 13
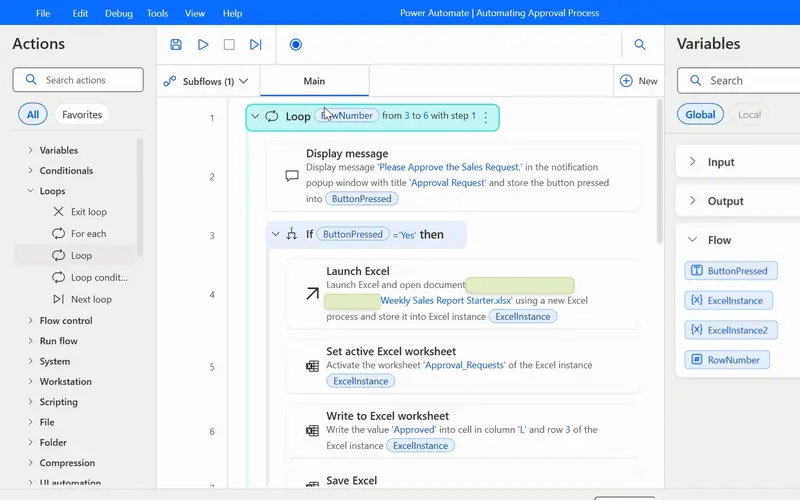
AutoFlow
The weekly report routine, run by a flow instead of by you.
Repetitive close steps handed to a desktop flow: Excel opened, rows read and checked in a loop, and a message box asking for approval before the result is written back.
-
Project 14
Agentic AI in Excel
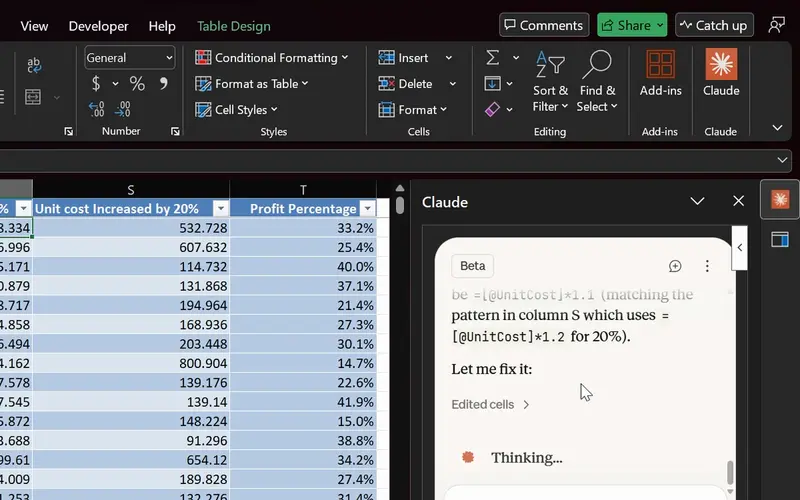
AI finds and fixes the formula; you check it before it counts.
Copilot's executive summary used as a first draft of commentary, with a short checklist to run before any of it is sent.
Lessons
The lessons that matter, in course order.
The Complete Excel Course with AI Integration has 186 lessons. This page picks out 62 of them, 5 h 28 min of video. Each lesson keeps its number in the course.
Where to start
Lesson 79 TaskFlow project tracker in Excel
Begin at Lesson 79 if SUMIFS, lookups and PivotTables are already part of your month: the path opens with TaskFlow, the model for a close tracker. If they are not, the formulas start at Lesson 28 and PivotTables at Lesson 57; if Excel is new, begin at Lesson 1. If your close is already tracked, go to Lesson 153 for consolidation.
62 of 186 lessons · 5 h 28 min
09 Project: task automation with data validation and forms TaskFlow as a close checklist: a tracker layout, status and priority drop-down lists, highlights for overdue and completed tasks, a Gantt-style timeline of the close, data bars, working days left with NETWORKDAYS and TODAY, and a protected sheet.
- 79 Start here TaskFlow project tracker in Excel Overview of the task tracker dashboard 4 min
- 80 Designing a task tracker in Excel TaskFlow layout, columns and headers 5 min
- 81 Data validation in Excel Status and priority drop-down lists in TaskFlow 8 min
- 82 Conditional formatting in Excel Highlight overdue and completed tasks 8 min
- 83 Gantt chart in Excel Build a project timeline with conditional formatting 6 min
- 84 Data bars and icon sets in Excel Visual priority and progress in TaskFlow 6 min
- 85 NETWORKDAYS and TODAY in Excel Days remaining and task deadlines in TaskFlow 5 min
- 86 Protect a sheet and lock cells in Excel Secure the TaskFlow tracker workbook 4 min
- 87 Testing an Excel task tracker Stress test TaskFlow with sample data 3 min
10 Boosting productivity with AI in Excel (Copilot, ChatGPT and Claude) Copilot for review work: an executive summary as a first draft of commentary, prompts that get a usable answer, PivotTables and charts from a prompt, conditional formatting that highlights problems, formula columns you verify, outliers, and a QA checklist before anything is relied on.
- 90 Copilot executive summary in Excel Summarise a dataset in seconds with AI 5 min
- 91 Copilot prompts for Excel Weak vs strong prompts and the PRO prompt pattern 5 min
- 92 PivotTables with Copilot Build an Excel PivotTable from a prompt 5 min
- 93 Charts with Copilot and ChatGPT Create and choose the right Excel chart 6 min
- 94 Conditional formatting with Copilot and ChatGPT Highlight problems in Excel 4 min
- 95 Excel formulas with AI Copilot and ChatGPT write formula columns you verify 6 min
- 96 Find outliers with Copilot in Excel Discounts, negative profit, suspect rows 7 min
- 97 Clean messy data with Copilot in Excel AI prompts plus Excel functions 4 min
- 98 Mini dashboard with Copilot in Excel KPIs, charts and slicers on one page 3 min
- 99 Check AI output in Excel A quick QA checklist for Copilot results 2 min
12 Project: FinanceGuard budget variance analyser (budget vs actual Excel dashboard) FinanceGuard, the budget vs actual page of a reporting pack: tables for budget and actuals, a model in SUMIFS and dynamic arrays, variance in money and percent with coloured number formats, a pivot workspace, KPI cards, a combo chart and slicers.
- 115 FinanceGuard budget vs actual dashboard Excel project overview 3 min
- 116 Excel tables for budget and actual data Organise the FinanceGuard datasets 4 min
- 117 Budget vs actual model in Excel SORT, UNIQUE, VSTACK, LET, TEXTSPLIT, SUMIFS 8 min
- 118 Budget variance in Excel Calculate variance and percent variance 4 min
- 119 Custom number formats in Excel Show budget variances with colours and signs 2 min
- 120 PivotTables for budget vs actual The FinanceGuard pivot workspace 8 min
- 121 KPI cards in Excel Summary cards for a budget variance dashboard 4 min
- 122 Budget vs actual charts in Excel Combo chart with secondary axis for variance 5 min
- 123 Slicers and PivotCharts in Excel Interactive FinanceGuard budget dashboard 4 min
- 124 Finish the FinanceGuard dashboard in Excel Final polish and variance insights 10 min
15 SalesFusion: advanced data tools and a Power Query modelling system SalesFusion: Power Query appends tables, combines a folder of files and builds one fact table; Power Pivot relates it to its lookup tables; DAX measures and a PivotTable report sit on top. The Power Pivot lessons need Excel for Windows.
- 153 SalesFusion Power Query project Excel ETL pipeline and data model overview 5 min
- 154 Introduction to Power Query in Excel The ETL workflow explained 5 min
- 155 Import a CSV with Power Query Get data from text and transform data 2 min
- 156 Clean columns in Power Query Remove and rename columns for modelling 5 min
- 157 Clean text in Power Query Trim, clean, replace values and fix text case 6 min
- 158 Data types in Power Query Fix date, whole number, decimal and text types 7 min
- 159 Date columns in Power Query Add year, month and year-month fields for reports 7 min
- 160 Business logic in Power Query Custom and conditional columns for profitability 6 min
- 161 Group By in Power Query Summarise sales by month and region to validate data 5 min
- 162 Close and Load in Power Query Connection only, table or Data Model 5 min
- 163 Merge queries in Power Query Look up product and region names with a left join 5 min
- 164 Reuse a Power Query pipeline Duplicate queries for a new year of sales data 5 min
- 165 Append queries in Power Query Combine 2024 and 2025 sales tables 3 min
- 166 From Folder in Power Query Combine every sales file in a folder automatically 9 min
- 167 From Folder automation in Power Query Profit metrics and fiscal year columns 7 min
- 168 Build a sales fact table in Power Query Merge lookups and append history 6 min
- 169 Power Pivot Data Model in Excel Relationships and Diagram View 6 min
- 170 DAX measures in Power Pivot Total sales, margin percent and percent of total 10 min
- 171 PivotTable report from the Data Model Format the SalesFusion report in Excel 5 min
- 172 Interactive Excel dashboard Data model PivotTables, slicers and styling 10 min
- 173 Unpivot columns in Power Query Turn wide month columns into a long table 8 min
16 Power Automate: weekly sales report automation AutoFlow: Power Automate Desktop flows that open Excel, read a worksheet, ask for approval through message box buttons, loop through rows and write results back, run from a desktop shortcut or a link. Power Automate Desktop needs Windows.
- 174 Power Automate Desktop for Excel Set up AutoFlow and your first automation 3 min
- 175 Your first Power Automate flow Flows, triggers, actions and Display message 3 min
- 176 Connect Excel to Power Automate Launch Excel and the Excel instance variable 3 min
- 177 Copilot Vision with Power Automate AI-guided help while you build a flow 2 min
- 178 Read data from Excel with Power Automate Read from worksheet and close Excel 4 min
- 179 Power Automate templates Search and replace Excel values template walkthrough 7 min
- 180 Run Power Automate flows From a desktop shortcut and a run URL 3 min
- 181 Power Automate Desktop recorder Record desktop and browser actions into a flow 4 min
- 182 Action properties in Power Automate UI elements, variables and wait settings 4 min
- 183 Approval flow in Power Automate Desktop If conditions and message box buttons 9 min
- 184 Loops in Power Automate Desktop Loop and For each actions for Excel rows 5 min
- 185 Power Automate Ninja Challenge Flag onboarded rows with loop, read, if, write 5 min
Instructors
Who teaches it.

Instructor, Excel with AI
Virginia Thorn
Emmy Award winner. Teaches Excel with AI at Coding Liquids.
Questions
Asked before starting.
Is there an Excel course for financial controllers?
Yes. The Complete Excel Course with AI Integration from Coding Liquids covers the Excel a controller's month runs on: a close tracker built the TaskFlow way, Copilot for drafting and checking, the FinanceGuard budget vs actual report, Power Query consolidation with a Power Pivot model, and Power Automate Desktop for steps that repeat. The 62 lessons here come to 5 hours 28 minutes of the course's 16 hours.
Does it teach consolidation accounting or close software?
No. The Complete Excel Course with AI Integration teaches Excel, not accounting: intercompany eliminations, foreign exchange translation, accounting standards and close or consolidation software are not covered. It teaches the Excel around a consolidation: Power Query to append each entity's file, a data model to relate the tables, and DAX measures to report on them.
Can AI write variance commentary?
It can draft it. In The Complete Excel Course with AI Integration Copilot writes an executive summary of a dataset in seconds, and a QA checklist for Copilot results follows in the same section, so what it says is checked against the figures before it goes into a pack. The course treats the draft as a starting point.
Can I automate approvals with Power Automate?
On the desktop, yes. AutoFlow in The Complete Excel Course with AI Integration builds a Power Automate Desktop flow with If conditions and message box buttons for an approval step, loops through Excel rows and writes the answer back, started from a shortcut or a link. The section covers Power Automate Desktop, not cloud flows, and it needs Windows.
How do I track the month-end close in Excel?
With a tracker like TaskFlow in The Complete Excel Course with AI Integration: one row per close task, drop-down lists for status and priority, conditional formatting that marks late and finished work, a Gantt-style timeline, NETWORKDAYS and TODAY for the working days left, and a protected sheet that stops formulas being typed over. It is taught as a task tracker; the close is one use of it.
Excel with AI
See the whole course.
The Complete Excel Course with AI Integration: 16 hours of video in 186 lessons, built around 14 projects, with lifetime access, a Certificate of Completion and a 14-day money-back guarantee.
The same course
For another job, level or topic.
By job
Finance and accounting
- Accountants and finance teams
- Bookkeepers and accounts assistants
- FP&A and budget analysts
- Auditors and fraud examiners
- Payroll administrators
- Tax accountants and advisers
- Banking professionals
- Cost and management accountants
- Credit control and receivables teams
- Accounts payable teams
- Financial planners and advisers
- Credit analysts and loan officers
- Insurance underwriters
- Insurance claims handlers
- Reconciliation analysts
- Treasury analysts
- Medical billing and coding specialists
- Fund accountants
- Billing administrators
- AML and KYC analysts
- Actuarial analysts
- Insurance agents and brokers
HR and office administration
Operations and supply chain
- Operations and project managers
- Procurement and purchasing officers
- Logistics coordinators
- Inventory controllers and storekeepers
- Supply chain analysts
- Warehouse managers and supervisors
- PMO analysts
- Import and export coordinators
- Production planners
- Demand planners
- Fleet and transport managers
- Apparel merchandisers
Data and reporting
Sales, marketing and customer service
Business and management
Engineering, construction and manufacturing
- Quantity surveyors and estimators
- Civil and site engineers
- Quality managers and engineers
- Construction project managers
- Health and safety officers
- Document controllers
- Production managers and supervisors
- Mechanical and electrical engineers
- Industrial engineers
- Planning engineers
- Sustainability and ESG analysts
- Maintenance planners