
The Complete Excel Course with AI Integration
Excel dashboard course: PivotTables, charts, slicers
For people who want to build dashboards in Excel that someone else can read and filter. The Complete Excel Course with AI Integration builds several: a marketing dashboard, a budget vs actual dashboard, a retirement simulator and a sales report on a data model. This page picks out those builds and the skills under them, charts and PivotTables.
Taught by Sagnik Bhattacharya and Virginia Thorn


What you will be able to do
At work, you will be able to:
- Build an interactive dashboard: PivotTables behind it, KPI cards on top, charts, a timeline and slicers to filter it.
- Choose the chart that fits the question, and format it so that it reads at a glance.
- Build a budget vs actual dashboard with variance colours, a combo chart with a secondary axis and slicers.
- Report from a Power Pivot data model, so the dashboard refreshes when the data does.
- Have Copilot or Claude draft a dashboard, and know what to check before you use it.
Projects
What you will build.
The course has 14 projects. These six matter most here.
-
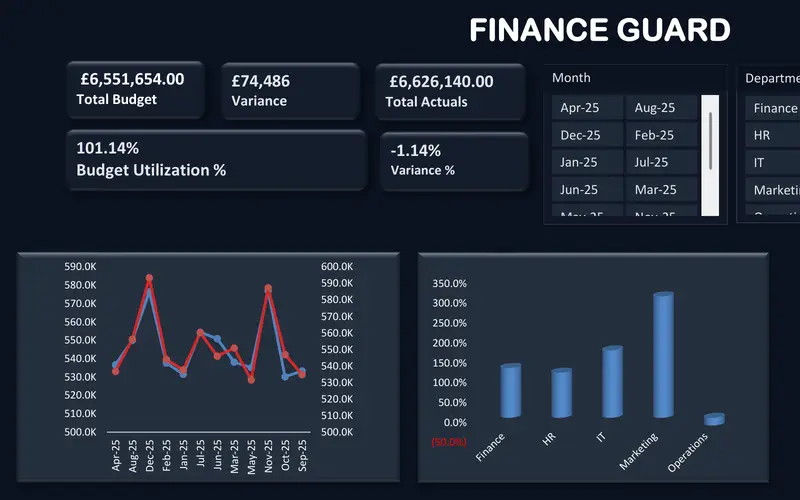
Project 09
FinanceGuard
The budget vs actual report finance teams send every month.
A dashboard that explains a gap: budget, actuals and variance by month and by department.
-
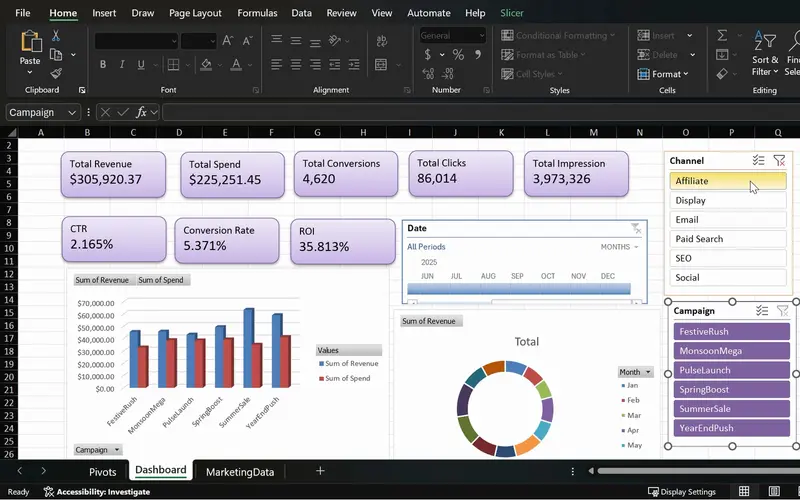
Project 08
MarketPulse
One screen that shows which campaigns earn back their spend.
A full interactive dashboard: KPI cards, a spend against revenue chart, a timeline and slicers.
-
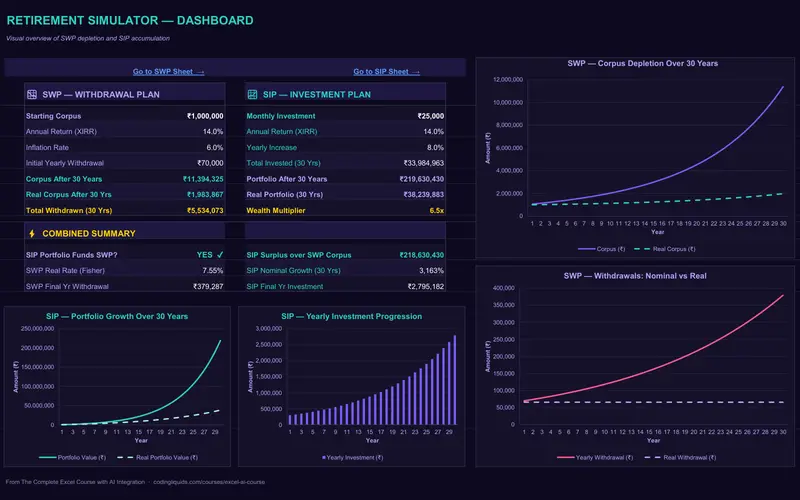
Project 10
WealthFlow
A retirement plan that shows how long the money lasts.
A simulator with charts of how a plan plays out over the years, and Claude building the dashboard.
-
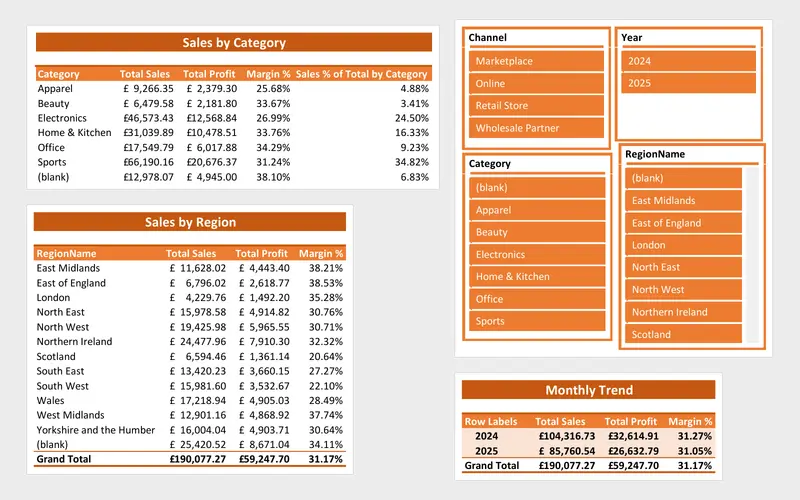
Project 12
SalesFusion
A sales report that refreshes itself from a folder of files.
A dashboard fed by a data model and refreshed from a folder of files.
-
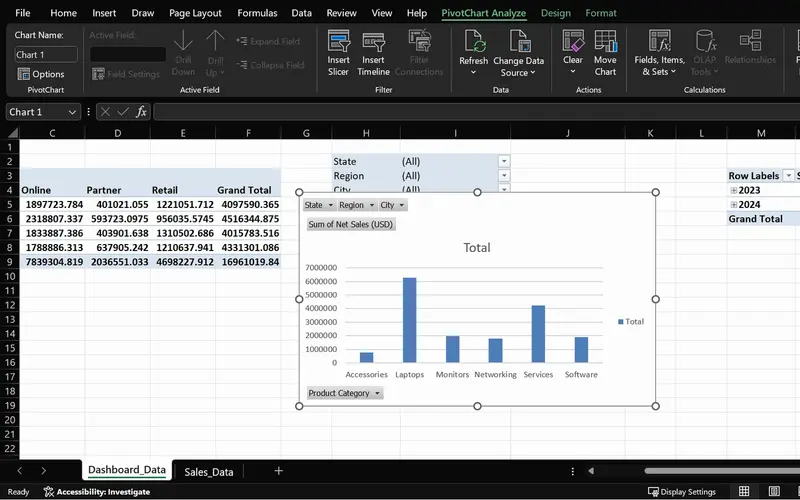
Project 05
SalesPlusPerformance
A sales question answered in seconds, straight from the order data.
PivotTables, a PivotChart and slicers working together: the pattern the later dashboards repeat.
-
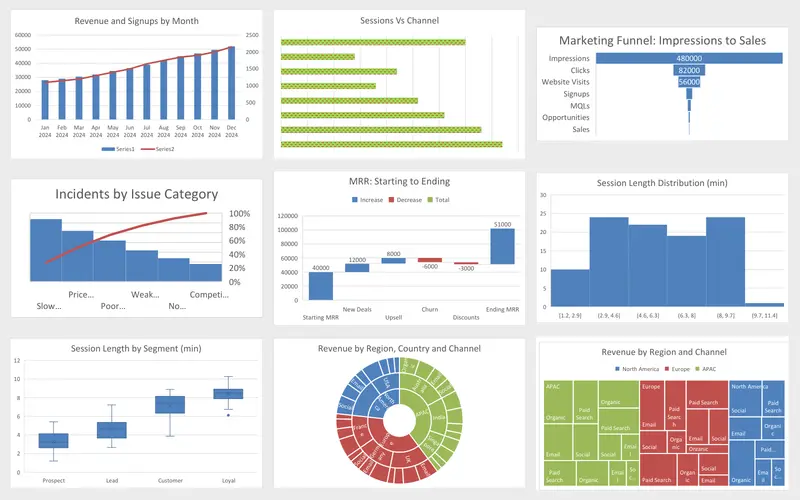
Project 04
Marketing Engagement Dashboard
Nine charts, each picked for the question it answers.
The chart types a dashboard draws on, each built once.
Lessons
The lessons that matter, in course order.
The Complete Excel Course with AI Integration has 186 lessons. This page picks out 46 of them, 3 h 40 min of video. Each lesson keeps its number in the course.
Where to start
Lesson 48 Choosing the right Excel chart
Begin at Lesson 48 if you can already write simple formulas. If charts are familiar, begin at the PivotTables, Lesson 57; if both are, go to Lesson 105, where the first full dashboard begins. New to Excel? Begin at Lesson 1.
46 of 186 lessons · 3 h 40 min
06 Data visualisation: charts and graphs Charts first: which chart for which question, column, line, pie and combo charts, formatting, sparklines, and the business charts (funnel, Pareto, waterfall, histogram, treemap, sunburst).
- 48 Start here Choosing the right Excel chart Column, line, pie, combo and modern chart types 4 min
- 49 Column charts in Excel Insert, format and label a column chart 5 min
- 50 Line charts in Excel Show trends over time with a line chart 4 min
- 51 Pie charts in Excel Show proportions and parts of a whole 4 min
- 52 Combo charts in Excel Column and line chart with a secondary axis 4 min
- 53 Formatting charts in Excel Titles, data labels, colours and chart styles 7 min
- 54 Sparklines in Excel Line, column and win-loss mini charts in cells 5 min
- 55 Funnel, Pareto and waterfall charts in Excel Modern charts for business data 5 min
- 56 Histogram, box and whisker, treemap and sunburst Advanced Excel chart types 6 min
07 PivotTables and PivotCharts: data analysis made easy PivotTables, slicers and PivotCharts, the engine most dashboards in the course run on, with report layouts, styles and Refresh.
- 57 PivotTables 101 in Excel What a PivotTable does and the sales dataset 5 min
- 58 Preparing data for PivotTables Clean data with TRIM, PROPER, find and replace 5 min
- 59 Create your first PivotTable in Excel Insert a PivotTable from a sales table 1 min
- 60 PivotTable fields in Excel Rows, values, columns and Value Field Settings 2 min
- 61 PivotTable summaries in Excel Sales by product category and grouping by date 4 min
- 62 Slicers in Excel Filter PivotTables with clickable buttons 3 min
- 63 PivotCharts in Excel Create interactive charts from a PivotTable 5 min
- 64 PivotTable design Tab Report layouts, PivotTable styles and number formats 5 min
- 65 Refresh a PivotTable in Excel Update pivots when source data changes 2 min
- 66 Excel Ninja Challenge PivotTable sales by region, category and monthly trend 1 min
10 Boosting productivity with AI in Excel (Copilot, ChatGPT and Claude) A mini dashboard with Copilot: KPIs, charts and slicers on one page.
- 98 Mini dashboard with Copilot in Excel KPIs, charts and slicers on one page 3 min
11 MarketPulse campaign intelligence dashboard MarketPulse, the full marketing dashboard: the PivotTable back end, the KPI formulas, PivotCharts and a timeline, KPI cards, slicers and the final polish.
- 105 MarketPulse marketing dashboard in Excel Project overview and campaign data 4 min
- 106 Clean and check marketing data in Excel Remove duplicates, Copilot KPI plan 4 min
- 107 Plan a marketing dashboard with ChatGPT KPIs and the PivotTable strategy 4 min
- 108 Marketing PivotTables in Excel Build the MarketPulse pivot back end 6 min
- 109 CTR, conversion rate and ROI in Excel Marketing KPI formulas with IFERROR 4 min
- 110 PivotTables with Copilot Generate and verify marketing pivots in Excel 6 min
- 111 Marketing charts and a timeline in Excel MarketPulse dashboard PivotCharts 4 min
- 112 KPI cards in Excel Marketing KPI cards for the MarketPulse dashboard 7 min
- 113 Slicers for an Excel dashboard Interactive filtering in MarketPulse 4 min
- 114 Polish an Excel marketing dashboard Final formatting and insights in MarketPulse 9 min
12 Project: FinanceGuard budget variance analyser (budget vs actual Excel dashboard) FinanceGuard, the budget vs actual dashboard: a formula model, variance with custom number formats, PivotTables, KPI cards, a combo chart with a secondary axis, slicers and the finishing touches.
- 115 FinanceGuard budget vs actual dashboard Excel project overview 3 min
- 116 Excel tables for budget and actual data Organise the FinanceGuard datasets 4 min
- 117 Budget vs actual model in Excel SORT, UNIQUE, VSTACK, LET, TEXTSPLIT, SUMIFS 8 min
- 118 Budget variance in Excel Calculate variance and percent variance 4 min
- 119 Custom number formats in Excel Show budget variances with colours and signs 2 min
- 120 PivotTables for budget vs actual The FinanceGuard pivot workspace 8 min
- 121 KPI cards in Excel Summary cards for a budget variance dashboard 4 min
- 122 Budget vs actual charts in Excel Combo chart with secondary axis for variance 5 min
- 123 Slicers and PivotCharts in Excel Interactive FinanceGuard budget dashboard 4 min
- 124 Finish the FinanceGuard dashboard in Excel Final polish and variance insights 10 min
13 WealthFlow investment and retirement simulator The retirement simulator of WealthFlow: the inputs and formulas behind it, reading the results, and Claude building the dashboard.
- 132 Retirement simulator in Excel WealthFlow inputs, year and age columns 5 min
- 133 Retirement simulator in Excel SIP, withdrawal and portfolio formulas with IF 7 min
- 134 Retirement simulator in Excel Reading the results and retirement scenarios 5 min
- 135 Retirement simulator in Excel Claude builds the WealthFlow dashboard 5 min
15 SalesFusion: advanced data tools and a Power Query modelling system A dashboard on a data model: a formatted PivotTable report from the SalesFusion model, then an interactive dashboard with slicers and styling. The model itself is built in the lessons before these.
- 171 PivotTable report from the Data Model Format the SalesFusion report in Excel 5 min
- 172 Interactive Excel dashboard Data model PivotTables, slicers and styling 10 min
Questions
Asked before starting.
Which Excel course teaches how to build dashboards?
The Complete Excel Course with AI Integration from Coding Liquids builds several, each as a project: MarketPulse, a marketing dashboard; FinanceGuard, a budget vs actual dashboard; the WealthFlow retirement simulator; and the SalesFusion sales dashboard on a data model. This page lists the dashboard lessons: 46 lessons, 3 hours 40 minutes of the course's 16 hours.
What do I need to know before building a dashboard in Excel?
Charts and PivotTables. This page lists those sections first, then the dashboards built on them. If formulas are new to you as well, start at the beginning of The Complete Excel Course with AI Integration; it builds up to the dashboards step by step.
Are the dashboards built with PivotTables or with formulas?
Both. The Complete Excel Course with AI Integration teaches each way: MarketPulse rests on PivotTables; FinanceGuard starts from a formula model written with SORT, UNIQUE, VSTACK, LET and SUMIFS and adds PivotTables for the charts; SalesFusion reports from a Power Pivot data model with DAX measures.
Does it teach Power BI or Tableau?
No. Every dashboard in The Complete Excel Course with AI Integration is an Excel workbook, and there are no Power BI or Tableau lessons. The closest to Power BI is the SalesFusion dashboard, which reports from a data model with DAX measures.
Will my dashboards update when the data changes?
Yes, each in its own way, as The Complete Excel Course with AI Integration builds them. A PivotTable dashboard updates with Refresh All, the FinanceGuard formula model recalculates when its budget and actual tables change, and the SalesFusion dashboard refreshes from a whole folder of files through Power Query.
Excel with AI
See the whole course.
The Complete Excel Course with AI Integration: 16 hours of video in 186 lessons, built around 14 projects, with lifetime access, a Certificate of Completion and a 14-day money-back guarantee.
The same course