
The Complete Excel Course with AI Integration
Power Query, Power Pivot and DAX course in Excel
For people who have outgrown copy and paste between files. The SalesFusion project of The Complete Excel Course with AI Integration teaches Power Query, the Power Pivot data model and DAX together, on sales data that arrives as separate CSV files. This page lists every lesson of it, with the PivotTables section it builds on.
Taught by Sagnik Bhattacharya and Virginia Thorn


What you will be able to do
At work, you will be able to:
- Import a CSV file with Power Query and shape it: remove and rename columns, trim and clean text, fix data types, and add year and month columns.
- Add business logic with custom and conditional columns, and check your work with Group By.
- Merge queries to look up names from another table, append one year to another, and combine every file in a folder automatically.
- Unpivot a wide table of month columns into a long one.
- Build a Power Pivot data model with relationships in Diagram View, and write DAX measures for total sales, margin percent and percent of total.
- Report from the data model with PivotTables, slicers and a dashboard.
Projects
What you will build.
The course has 14 projects. These two matter most here.
-
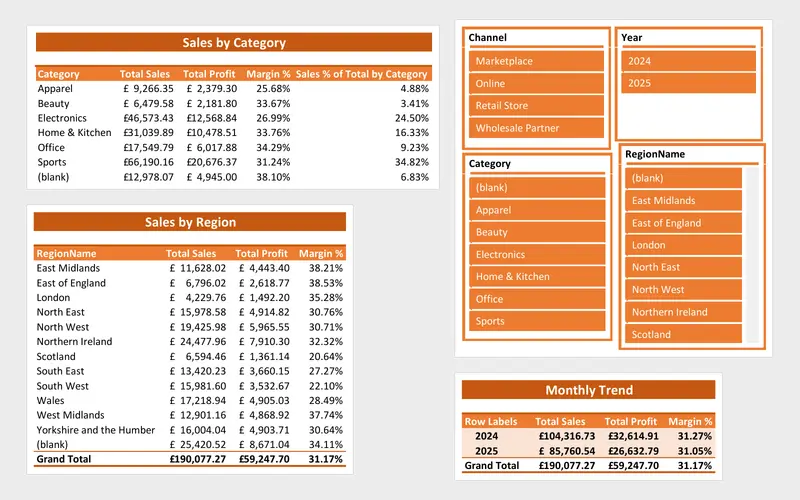
Project 12
SalesFusion
A sales report that refreshes itself from a folder of files.
The whole chain in one project: a folder of raw sales files becomes a clean model with measures, and a report that refreshes itself from that folder.
-
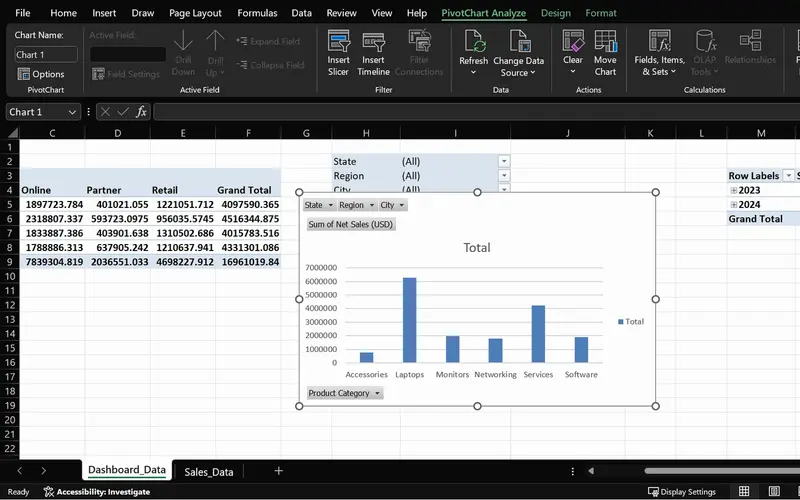
Project 05
SalesPlusPerformance
A sales question answered in seconds, straight from the order data.
The PivotTables the data model later feeds: fields, grouping by date, slicers and Refresh.
Lessons
The lessons that matter, in course order.
The Complete Excel Course with AI Integration has 186 lessons. This page picks out 31 of them, 2 h 40 min of video. Each lesson keeps its number in the course.
Where to start
Lesson 153 SalesFusion Power Query project
Begin at Lesson 153 if you already build PivotTables. If you do not, watch the PivotTables section first, from Lesson 57: it is short, and the data model reports through PivotTables.
31 of 186 lessons · 2 h 40 min
07 PivotTables and PivotCharts: data analysis made easy PivotTables first: the data model you build later reports through PivotTables, so this short section comes before it.
- 57 PivotTables 101 in Excel What a PivotTable does and the sales dataset 5 min
- 58 Preparing data for PivotTables Clean data with TRIM, PROPER, find and replace 5 min
- 59 Create your first PivotTable in Excel Insert a PivotTable from a sales table 1 min
- 60 PivotTable fields in Excel Rows, values, columns and Value Field Settings 2 min
- 61 PivotTable summaries in Excel Sales by product category and grouping by date 4 min
- 62 Slicers in Excel Filter PivotTables with clickable buttons 3 min
- 63 PivotCharts in Excel Create interactive charts from a PivotTable 5 min
- 64 PivotTable design Tab Report layouts, PivotTable styles and number formats 5 min
- 65 Refresh a PivotTable in Excel Update pivots when source data changes 2 min
- 66 Excel Ninja Challenge PivotTable sales by region, category and monthly trend 1 min
15 SalesFusion: advanced data tools and a Power Query modelling system SalesFusion, every lesson: the ETL workflow, importing a CSV, cleaning columns and text, data types and date columns, custom and conditional columns, Group By, Close and Load, merge, append, From Folder, a sales fact table, the Power Pivot data model, DAX measures, a PivotTable report, an interactive dashboard and Unpivot.
- 153 Start here SalesFusion Power Query project Excel ETL pipeline and data model overview 5 min
- 154 Introduction to Power Query in Excel The ETL workflow explained 5 min
- 155 Import a CSV with Power Query Get data from text and transform data 2 min
- 156 Clean columns in Power Query Remove and rename columns for modelling 5 min
- 157 Clean text in Power Query Trim, clean, replace values and fix text case 6 min
- 158 Data types in Power Query Fix date, whole number, decimal and text types 7 min
- 159 Date columns in Power Query Add year, month and year-month fields for reports 7 min
- 160 Business logic in Power Query Custom and conditional columns for profitability 6 min
- 161 Group By in Power Query Summarise sales by month and region to validate data 5 min
- 162 Close and Load in Power Query Connection only, table or Data Model 5 min
- 163 Merge queries in Power Query Look up product and region names with a left join 5 min
- 164 Reuse a Power Query pipeline Duplicate queries for a new year of sales data 5 min
- 165 Append queries in Power Query Combine 2024 and 2025 sales tables 3 min
- 166 From Folder in Power Query Combine every sales file in a folder automatically 9 min
- 167 From Folder automation in Power Query Profit metrics and fiscal year columns 7 min
- 168 Build a sales fact table in Power Query Merge lookups and append history 6 min
- 169 Power Pivot Data Model in Excel Relationships and Diagram View 6 min
- 170 DAX measures in Power Pivot Total sales, margin percent and percent of total 10 min
- 171 PivotTable report from the Data Model Format the SalesFusion report in Excel 5 min
- 172 Interactive Excel dashboard Data model PivotTables, slicers and styling 10 min
- 173 Unpivot columns in Power Query Turn wide month columns into a long table 8 min
Questions
Asked before starting.
Is there an Excel course that teaches Power Query, Power Pivot and DAX together?
Yes. The Complete Excel Course with AI Integration from Coding Liquids teaches all three on one project, SalesFusion: Power Query cleans and combines a folder of CSV files, Power Pivot relates the tables in a data model, and DAX measures feed a report and a dashboard. With the PivotTables section before it, that is 31 lessons, 2 hours 40 minutes.
Do I need Power BI to learn Power Query and DAX?
No. Everything in The Complete Excel Course with AI Integration happens in Excel: Power Query, the Power Pivot data model and DAX measures are all part of Excel for Windows. Power BI uses the same three, so a reader who moves to it later starts with the tools already known.
How much DAX does the course teach?
A working start, not a course on DAX alone. The Complete Excel Course with AI Integration has a lesson on DAX measures in Power Pivot that writes total sales, margin percent and percent of total, and the lessons after it use those measures in a PivotTable report and a dashboard.
Does Power Pivot work on a Mac?
No. Power Pivot is not part of Excel for Mac, which is why the requirements of The Complete Excel Course with AI Integration say its section needs Windows. The PivotTables section on this page works on a Mac as well.
What should I know before starting Power Query?
Excel tables and PivotTables. Tables are taught early in The Complete Excel Course with AI Integration, and the PivotTables section is listed on this page before SalesFusion. No programming experience is assumed.
Excel with AI
See the whole course.
The Complete Excel Course with AI Integration: 16 hours of video in 186 lessons, built around 14 projects, with lifetime access, a Certificate of Completion and a 14-day money-back guarantee.
The same course