



The Complete Excel Course with AI Integration
Excel course for business intelligence analysts
For business intelligence analysts building Excel models and dashboards, this guide selects the BI material in The Complete Excel Course with AI Integration. SalesFusion covers Power Query, Power Pivot modelling and DAX measures; MarketPulse brings KPI cards, slicers and a timeline into a dashboard; AutoFlow passes routine work to Power Automate Desktop.
Taught by Sagnik Bhattacharya and Virginia Thorn

What you will be able to do
At work, you will be able to:
- Prepare CSV data with Power Query, correcting types, merging and appending queries, combining files from a folder and unpivoting wide month columns.
- Connect a fact table to lookup tables in a data model using Power Pivot's Diagram View.
- Calculate total sales, margin percent and percent of total with DAX measures, then place those measures in PivotTables based on the data model.
- Bring KPI cards and PivotCharts together in a dashboard that readers can filter with slicers and a timeline.
- Validate model figures before publication by comparing them with a Power Query Group By summary of the source.
- Use a Power Automate Desktop flow to open and read a workbook, then write results back as part of routine work.
Projects
What you will build.
The course has 14 projects. These three matter most here.
-
Project 12
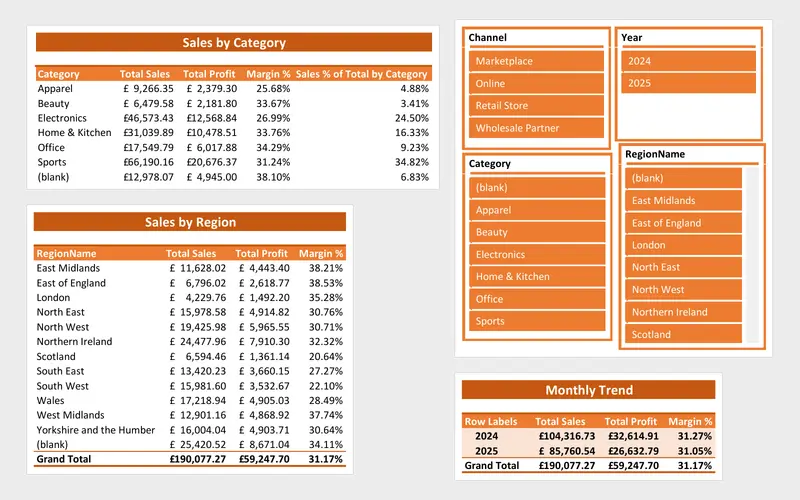
SalesFusion
A sales report that refreshes itself from a folder of files.
Examine how a model fits together, from a Power Query sales fact table and lookup relationships in Diagram View to DAX calculations for total sales, margin percent and percent of total.
-
Project 08
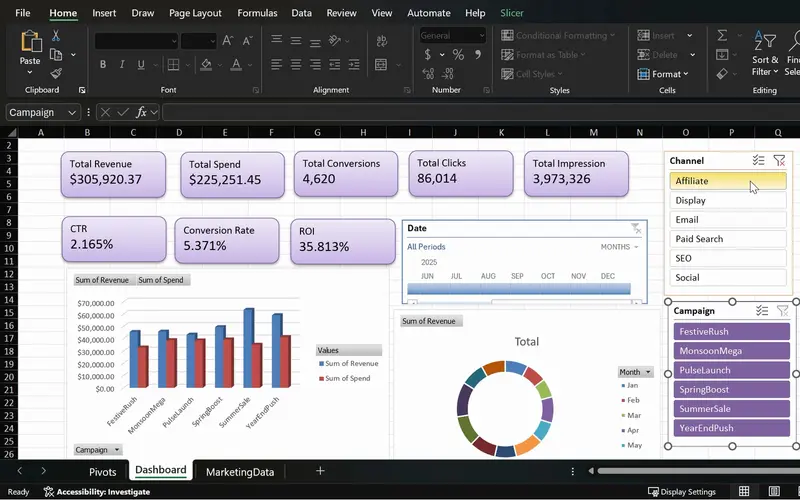
MarketPulse
One screen that shows which campaigns earn back their spend.
Prepare a dashboard for handover as a BI analyst, arranging KPI cards, PivotCharts, slicers and a timeline together and protecting rate calculations with IFERROR.
-
Project 13
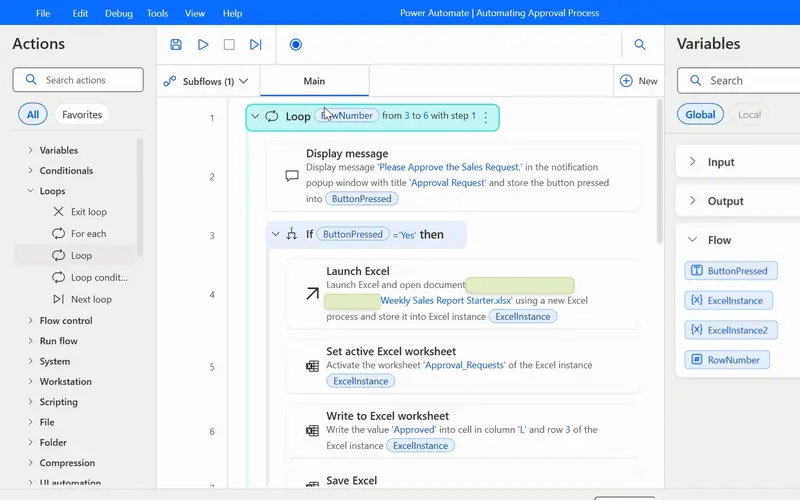
AutoFlow
The weekly report routine, run by a flow instead of by you.
Start a Power Automate Desktop flow from a shortcut or link to handle routine report steps: open the workbook, read its rows, test each row with a condition and write the result.
Lessons
The lessons that matter, in course order.
The Complete Excel Course with AI Integration has 186 lessons. This page picks out 43 of them, 3 h 50 min of video. Each lesson keeps its number in the course.
Where to start
Lesson 105 MarketPulse marketing dashboard in Excel
With PivotTables and lookups already familiar, start at Lesson 105 to build a dashboard before learning to build the model beneath one. For a grounding in PivotTables, start at Lesson 57; for an introduction to Excel, use Lesson 1. If dashboard building is already routine, begin the Power Query material at Lesson 153.
43 of 186 lessons · 3 h 50 min
11 MarketPulse campaign intelligence dashboard Build the MarketPulse dashboard in Excel, starting with source cleaning and checks and KPI planning with ChatGPT and Copilot. Calculate rates using IFERROR and create PivotTables, followed by PivotCharts, KPI cards, slicers and a timeline.
- 105 Start here MarketPulse marketing dashboard in Excel Project overview and campaign data 4 min
- 106 Clean and check marketing data in Excel Remove duplicates, Copilot KPI plan 4 min
- 107 Plan a marketing dashboard with ChatGPT KPIs and the PivotTable strategy 4 min
- 108 Marketing PivotTables in Excel Build the MarketPulse pivot back end 6 min
- 109 CTR, conversion rate and ROI in Excel Marketing KPI formulas with IFERROR 4 min
- 110 PivotTables with Copilot Generate and verify marketing pivots in Excel 6 min
- 111 Marketing charts and a timeline in Excel MarketPulse dashboard PivotCharts 4 min
- 112 KPI cards in Excel Marketing KPI cards for the MarketPulse dashboard 7 min
- 113 Slicers for an Excel dashboard Interactive filtering in MarketPulse 4 min
- 114 Polish an Excel marketing dashboard Final formatting and insights in MarketPulse 9 min
15 SalesFusion: advanced data tools and a Power Query modelling system Follow SalesFusion from source preparation to a PivotTable report and dashboard based on a data model. Its Power Query ETL work covers cleaning, type corrections, conditional columns, merging, appending, combining a folder of files and unpivoting. Build a sales fact table, connect tables in Power Pivot's Diagram View and write DAX measures. Excel for Windows is required for the Power Pivot lessons.
- 153 SalesFusion Power Query project Excel ETL pipeline and data model overview 5 min
- 154 Introduction to Power Query in Excel The ETL workflow explained 5 min
- 155 Import a CSV with Power Query Get data from text and transform data 2 min
- 156 Clean columns in Power Query Remove and rename columns for modelling 5 min
- 157 Clean text in Power Query Trim, clean, replace values and fix text case 6 min
- 158 Data types in Power Query Fix date, whole number, decimal and text types 7 min
- 159 Date columns in Power Query Add year, month and year-month fields for reports 7 min
- 160 Business logic in Power Query Custom and conditional columns for profitability 6 min
- 161 Group By in Power Query Summarise sales by month and region to validate data 5 min
- 162 Close and Load in Power Query Connection only, table or Data Model 5 min
- 163 Merge queries in Power Query Look up product and region names with a left join 5 min
- 164 Reuse a Power Query pipeline Duplicate queries for a new year of sales data 5 min
- 165 Append queries in Power Query Combine 2024 and 2025 sales tables 3 min
- 166 From Folder in Power Query Combine every sales file in a folder automatically 9 min
- 167 From Folder automation in Power Query Profit metrics and fiscal year columns 7 min
- 168 Build a sales fact table in Power Query Merge lookups and append history 6 min
- 169 Power Pivot Data Model in Excel Relationships and Diagram View 6 min
- 170 DAX measures in Power Pivot Total sales, margin percent and percent of total 10 min
- 171 PivotTable report from the Data Model Format the SalesFusion report in Excel 5 min
- 172 Interactive Excel dashboard Data model PivotTables, slicers and styling 10 min
- 173 Unpivot columns in Power Query Turn wide month columns into a long table 8 min
16 Power Automate: weekly sales report automation Use AutoFlow to build Power Automate Desktop flows that open Excel, read worksheet data, work through rows with loops, apply conditions and approvals, and write data back. Launch the flows through a desktop shortcut or a link. Windows is the only platform on which Power Automate Desktop runs.
- 174 Power Automate Desktop for Excel Set up AutoFlow and your first automation 3 min
- 175 Your first Power Automate flow Flows, triggers, actions and Display message 3 min
- 176 Connect Excel to Power Automate Launch Excel and the Excel instance variable 3 min
- 177 Copilot Vision with Power Automate AI-guided help while you build a flow 2 min
- 178 Read data from Excel with Power Automate Read from worksheet and close Excel 4 min
- 179 Power Automate templates Search and replace Excel values template walkthrough 7 min
- 180 Run Power Automate flows From a desktop shortcut and a run URL 3 min
- 181 Power Automate Desktop recorder Record desktop and browser actions into a flow 4 min
- 182 Action properties in Power Automate UI elements, variables and wait settings 4 min
- 183 Approval flow in Power Automate Desktop If conditions and message box buttons 9 min
- 184 Loops in Power Automate Desktop Loop and For each actions for Excel rows 5 min
- 185 Power Automate Ninja Challenge Flag onboarded rows with loop, read, if, write 5 min
Instructors
Who teaches it.

Instructor, Excel with AI
Virginia Thorn
Emmy Award winner. Teaches Excel with AI at Coding Liquids.
Questions
Asked before starting.
Which Excel course covers BI work for business intelligence analysts?
The Complete Excel Course with AI Integration from Coding Liquids covers BI work within Excel, from Power Query ETL that combines files in a folder to related tables in a Power Pivot data model and DAX measures. It also covers PivotTable reports, dashboards with KPI cards, slicers and a timeline, and routine work using Power Automate Desktop. This page selects 43 lessons, taking 3 hours 50 minutes from the course's 16 hours.
How much DAX does the course teach business intelligence analysts?
The Complete Excel Course with AI Integration covers the measures needed for an initial Power Pivot data model: total sales, margin percent and percent of total. You then put those measures into PivotTable reports and a dashboard. It does not teach CALCULATE patterns, time intelligence or other advanced DAX.
Will business intelligence analysts learn Power BI, SQL or data warehousing here?
Power BI, SQL and data warehousing are outside the scope of The Complete Excel Course with AI Integration. The course focuses on Excel, with SalesFusion using Excel's Power Query and Power Pivot for modelling. Excel for Windows is needed for the Power Pivot lessons and the Power Automate material.
How can business intelligence analysts check dashboard figures against their source?
In The Complete Excel Course with AI Integration, you use Power Query's Group By to summarise source data by month and region and check the loaded data. You also learn to rebuild tables from the files with Refresh and create PivotTables from the data model. Before publishing, compare the totals in those PivotTables with the source summary.
Excel with AI
See the whole course.
The Complete Excel Course with AI Integration: 16 hours of video in 186 lessons, built around 14 projects, with lifetime access, a Certificate of Completion and a 14-day money-back guarantee.
The same course
For another job, level or topic.
By job
Finance and accounting
- Accountants and finance teams
- Bookkeepers and accounts assistants
- FP&A and budget analysts
- Auditors and fraud examiners
- Payroll administrators
- Tax accountants and advisers
- Banking professionals
- Cost and management accountants
- Financial controllers
- Credit control and receivables teams
- Accounts payable teams
- Financial planners and advisers
- Credit analysts and loan officers
- Insurance underwriters
- Insurance claims handlers
- Reconciliation analysts
- Treasury analysts
- Medical billing and coding specialists
- Fund accountants
- Billing administrators
- AML and KYC analysts
- Actuarial analysts
- Insurance agents and brokers
HR and office administration
Operations and supply chain
- Operations and project managers
- Procurement and purchasing officers
- Logistics coordinators
- Inventory controllers and storekeepers
- Supply chain analysts
- Warehouse managers and supervisors
- PMO analysts
- Import and export coordinators
- Production planners
- Demand planners
- Fleet and transport managers
- Apparel merchandisers
Data and reporting
Sales, marketing and customer service
Business and management
Engineering, construction and manufacturing
- Quantity surveyors and estimators
- Civil and site engineers
- Quality managers and engineers
- Construction project managers
- Health and safety officers
- Document controllers
- Production managers and supervisors
- Mechanical and electrical engineers
- Industrial engineers
- Planning engineers
- Sustainability and ESG analysts
- Maintenance planners