



The Complete Excel Course with AI Integration
Excel course for restaurant managers and chefs
For kitchen managers, head chefs and restaurant managers who cost recipes and track their figures in Excel, this guide highlights the relevant material in The Complete Excel Course with AI Integration. The course contains no restaurant data of its own, but these selected lessons cover the formulas those spreadsheets rely on: initial arithmetic and percentages, conditional formatting and category totals, IF and SUMIFS, ingredient lookups, and the FinanceGuard budget vs actual report.
Taught by Sagnik Bhattacharya and Virginia Thorn

What you will be able to do
At work, you will be able to:
- Determine the cost of a recipe and single portion by multiplying ingredients by their unit cost retrieved through XLOOKUP, summing the total with SUM, and dividing by portion count.
- Calculate food cost percentage against a selling figure, or work out the selling figure implied by a target food cost, using percentage formatting and absolute cell references.
- Calculate stock usage and waste by item and reason using SUMIFS, and apply colour formatting to highlight expired items or stock falling below par levels.
- Calculate weekly staff hours and overall labour cost from a rota sheet, then display labour spend as a share of sales.
- Measure monthly food, drink, labour and overhead spending against the budget, highlighting numerical variance and percentage variance in colour.
Projects
What you will build.
The course has 14 projects. These four matter most here.
-
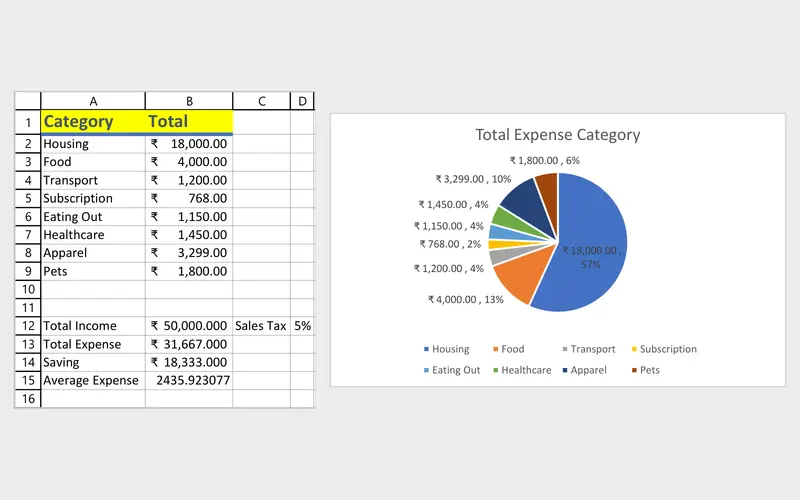
Project 01
Personal Budget Tracker
Your first workbook: where the money goes each month.
Spreadsheet techniques for kitchen finance: calculating totals and averages, using colour rules to flag dishes over target cost, and summarising expenditure by category in a pie chart.
-
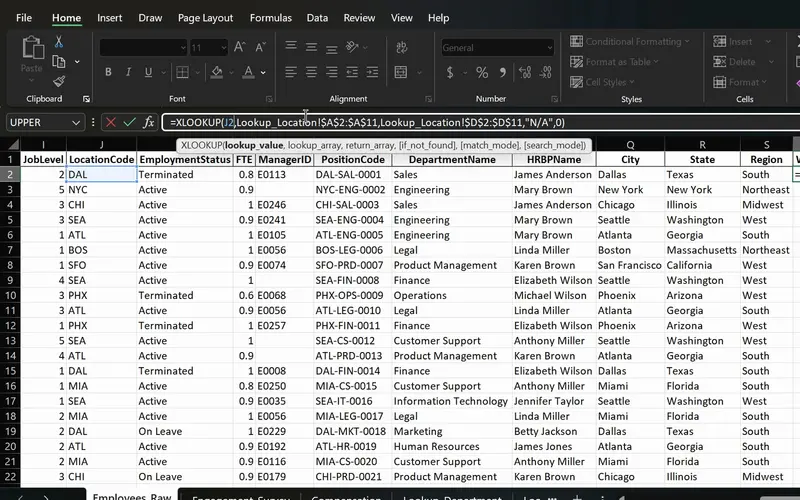
Project 06
PeopleInsight HR workbook
Employee data joined across sheets with one formula.
Bringing ingredient unit costs into dish sheets by name with XLOOKUP, so updated supplier figures carry through to recipes that incorporate them.
-
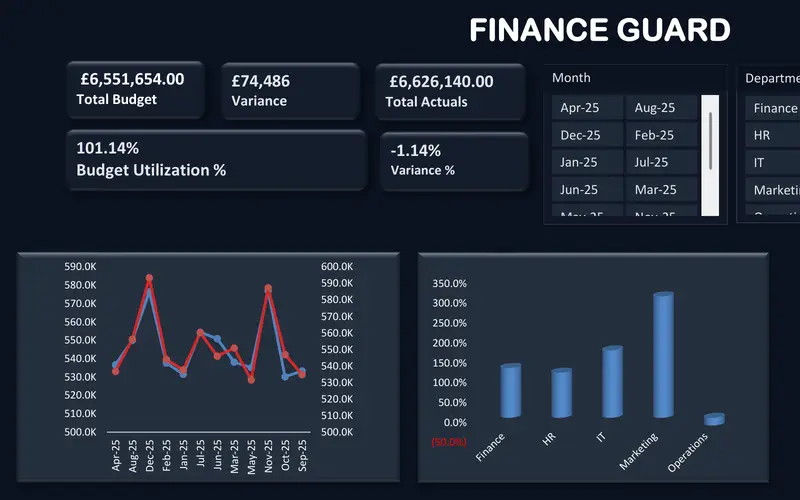
Project 09
FinanceGuard
The budget vs actual report finance teams send every month.
Its budget against actual model suits monthly food, beverage, labour and overhead spending reviewed against budget, with colour-coded variances and a dashboard that illustrates where funds went.
-
Project 03
Sales Goal Tracker
Tracking daily covers and takings against target using IF and SUMIFS, adding waste by reason with SUMIF, and counting days exceeding food cost targets using COUNTIFS.
Lessons
The lessons that matter, in course order.
The Complete Excel Course with AI Integration has 186 lessons. This page picks out 40 of them, 3 h 30 min of video. Each lesson keeps its number in the course.
Where to start
Lesson 5 Your first Excel spreadsheet
If you have never worked with Excel, begin at Lesson 1. For those who have opened spreadsheets before but seldom build formulas, start at Lesson 5: a recipe costing starts with quantities, unit costs and SUM. If formulas are familiar, go to Lesson 68 to connect recipe sheets to an ingredient list, or jump to Lesson 115, where comparing costs against budget begins.
40 of 186 lessons · 3 h 30 min
01 Microsoft Excel fundamentals: building a foundation from scratch Constructing a costing sheet from scratch: understanding cells and data types, formatting numbers, multiplying quantities by unit costs, totalling recipes with SUM, using absolute references for portion counts, calculating food cost percentages, correcting errors, and organising workbooks into recipe, ingredient and summary sheets, taught using a personal budget.
- 5 Start here Your first Excel spreadsheet Cells, rows, columns and data types in a budget 8 min
- 6 Number formatting in Excel Currency, date and percentage formats for a budget 5 min
- 7 Cell formatting in Excel AutoFit column width, the #### error and cell styles 6 min
- 8 Basic maths in Excel Add, subtract, multiply and divide with formulas 3 min
- 9 SUM and AutoSum in Excel Total income, expenses and savings with MAX 6 min
- 10 Relative vs absolute references in Excel Dollar signs and mixed references 3 min
- 11 Calculating percentages in Excel Each expense as a percentage of income 2 min
- 12 Common Excel errors and how to fix them DIV0, NAME, VALUE errors and IFERROR 4 min
- 13 Organising an Excel workbook Dashboard, transactions and notes sheets 2 min
02 Project: personal budget tracker Calculating totals and averages, highlighting plates that exceed target food costs, organising expenditure into categories such as dairy, produce and meat, and displaying spend in a pie chart. The project builds a personal budget tracker; a kitchen's purchases sort the same way.
- 14 SUM and AVERAGE in Excel Personal budget tracker totals and average expense 4 min
- 15 Conditional formatting in Excel Highlight rules, data bars and icon sets 3 min
- 16 Monthly expense summary in Excel Category totals for a personal budget tracker 7 min
- 17 Excel charts for beginners Pie chart of budget expenses by category 8 min
04 Essential formulas and functions (IF, SUMIF and more) Using IF to evaluate dishes against cost targets, nested IF and IFS for cost tiers, SUMIF and SUMIFS to aggregate waste by reason and week, COUNTIFS for days when labour exceeded target, and date functions including TODAY to monitor use-by dates.
- 28 Logical functions in Excel TRUE and FALSE comparisons for beginners 5 min
- 29 The IF function in Excel Pass or fail results with a single condition 3 min
- 30 IF function practice in Excel Categorise sales data with IF formulas 6 min
- 31 Nested IF and IFS in Excel Customer value tiers with nested IF 6 min
- 32 Nested IF and IFS in Excel Sales performance labels with the IFS function 5 min
- 33 AND and OR with IF in Excel Flag high-value deals with multiple conditions 8 min
- 34 SUM, COUNT and COUNTA in Excel SUM with FILTER and counting numbers with COUNT 7 min
- 35 SUM, COUNT and COUNTA in Excel COUNTA, unique counts and completeness checks 4 min
- 36 SUMIF and COUNTIF in Excel Conditional sum and count with one criterion 8 min
- 37 SUMIFS and COUNTIFS in Excel Sum and count with multiple criteria 7 min
- 38 The Excel function library Insert Function dialog and Formula AutoComplete 5 min
- 39 Date and time functions in Excel TODAY, NOW, MONTH and date arithmetic 6 min
- 40 Excel Ninja Challenge COUNTIF, SUMIF, IF, COUNTIFS, SUMIFS and IFS practice 8 min
08 Advanced Excel functions: lookups, text and arrays Lookup functions connecting ingredient lists to recipe sheets: retrieving unit costs by item name using VLOOKUP, XLOOKUP, or INDEX and MATCH, with IFERROR handling missing items, illustrated through HR records that function like kitchen ingredient lists.
- 68 VLOOKUP in Excel Find employee data across sheets with exact match 4 min
- 69 XLOOKUP in Excel Exact match, if not found and two-way lookup 6 min
- 70 IFERROR in Excel Handle lookup errors in VLOOKUP and XLOOKUP formulas 3 min
- 71 INDEX and MATCH in Excel A flexible alternative to VLOOKUP 6 min
12 Project: FinanceGuard budget variance analyser (budget vs actual Excel dashboard) Managing monthly expenditure with FinanceGuard: tracking food, beverage, labour and overhead costs against budget, calculating variance and percent variance with colour formatting for overspends, and using PivotTables, KPI cards, a combo chart and slicers. The project uses a company budget; a restaurant's cost lines fit into the same columns.
- 115 FinanceGuard budget vs actual dashboard Excel project overview 3 min
- 116 Excel tables for budget and actual data Organise the FinanceGuard datasets 4 min
- 117 Budget vs actual model in Excel SORT, UNIQUE, VSTACK, LET, TEXTSPLIT, SUMIFS 8 min
- 118 Budget variance in Excel Calculate variance and percent variance 4 min
- 119 Custom number formats in Excel Show budget variances with colours and signs 2 min
- 120 PivotTables for budget vs actual The FinanceGuard pivot workspace 8 min
- 121 KPI cards in Excel Summary cards for a budget variance dashboard 4 min
- 122 Budget vs actual charts in Excel Combo chart with secondary axis for variance 5 min
- 123 Slicers and PivotCharts in Excel Interactive FinanceGuard budget dashboard 4 min
- 124 Finish the FinanceGuard dashboard in Excel Final polish and variance insights 10 min
Instructors
Who teaches it.

Instructor, Excel with AI
Virginia Thorn
Emmy Award winner. Teaches Excel with AI at Coding Liquids.
Questions
Asked before starting.
Is there an Excel course suited to restaurant managers and chefs?
Yes. The Complete Excel Course with AI Integration from Coding Liquids teaches the spreadsheets required in restaurants and commercial kitchens: calculating recipe and portion costs with XLOOKUP, determining food cost percentages, tracking stock and wastage totals with SUMIFS, comparing labour against sales, and monitoring monthly expenditure against budget in FinanceGuard. Starting right from the beginning, this guide outlines 40 lessons, taking 3 hours 30 minutes altogether.
Can chefs and restaurant managers calculate recipe and portion costs in Excel?
Yes. By maintaining a single ingredient sheet with the cost per unit, each recipe tab can use XLOOKUP to look up an ingredient cost by name, multiply by the quantity required, add the totals with SUM, and divide by the portion count. In The Complete Excel Course with AI Integration, you cover each stage: basic arithmetic, SUM, absolute cell references, lookup functions, and handling unlisted items with IFERROR. When supplier costs shift, linked recipes update accordingly, while trim loss and yields remain for you to enter.
How do restaurant managers and chefs determine food cost percentage?
Divide the portion cost by the dish selling figure and format as a percentage; to calculate what selling figure a target food cost requires, divide portion cost by that target percentage. The Complete Excel Course with AI Integration demonstrates percentage calculations, absolute references to keep a target benchmark in a single cell, and conditional formatting to highlight dishes that exceed it. The exercises use personal budget figures, but the mathematical formulas apply directly to kitchen operations.
Can restaurant managers track labour costs against sales in Excel?
From an Excel standpoint, yes. You can enter rota hours per employee per day, multiply by individual hourly rates kept in individual cells, and calculate weekly labour using SUMIFS; dividing by weekly sales provides labour as a percentage, while an IF formula flags weeks that exceed the target. The Complete Excel Course with AI Integration demonstrates these techniques using sales and budget examples, though employment legislation and rota scheduling rules are not taught.
Does the course cover menu engineering or food safety logs for chefs and restaurant managers?
No. The Complete Excel Course with AI Integration focuses on spreadsheet skills rather than kitchen operations: it does not cover food safety standards, hygiene documentation, menu engineering, or point-of-sale software, and its exercises do not use restaurant data. It covers the supporting calculations: costing recipes and portions, food cost percentages, inventory and waste totals, labour relative to sales, and monthly budget performance.
Excel with AI
See the whole course.
The Complete Excel Course with AI Integration: 16 hours of video in 186 lessons, built around 14 projects, with lifetime access, a Certificate of Completion and a 14-day money-back guarantee.
The same course
For another job, level or topic.
By job
Finance and accounting
- Accountants and finance teams
- Bookkeepers and accounts assistants
- FP&A and budget analysts
- Auditors and fraud examiners
- Payroll administrators
- Tax accountants and advisers
- Banking professionals
- Cost and management accountants
- Financial controllers
- Credit control and receivables teams
- Accounts payable teams
- Financial planners and advisers
- Credit analysts and loan officers
- Insurance underwriters
- Insurance claims handlers
- Reconciliation analysts
- Treasury analysts
- Medical billing and coding specialists
- Fund accountants
- Billing administrators
- AML and KYC analysts
- Actuarial analysts
- Insurance agents and brokers
HR and office administration
Operations and supply chain
- Operations and project managers
- Procurement and purchasing officers
- Logistics coordinators
- Inventory controllers and storekeepers
- Supply chain analysts
- Warehouse managers and supervisors
- PMO analysts
- Import and export coordinators
- Production planners
- Demand planners
- Fleet and transport managers
- Apparel merchandisers
Data and reporting
Sales, marketing and customer service
Business and management
Engineering, construction and manufacturing
- Quantity surveyors and estimators
- Civil and site engineers
- Quality managers and engineers
- Construction project managers
- Health and safety officers
- Document controllers
- Production managers and supervisors
- Mechanical and electrical engineers
- Industrial engineers
- Planning engineers
- Sustainability and ESG analysts
- Maintenance planners