



The Complete Excel Course with AI Integration
Excel course for production managers
For production managers and supervisors who report output, downtime and scrap in Excel. None of the course's data comes from a factory; this page picks out the lessons a production report is built from: conditional totals against plan, percentages for OEE, lookups for standard rates, the Pareto chart for downtime, PivotTables for scrap, a dashboard with KPI cards, and recorded macros for the shift report.
Taught by Sagnik Bhattacharya and Virginia Thorn

What you will be able to do
At work, you will be able to:
- Report output against plan by shift, line and product with SUMIFS, and flag a shift below plan with IF.
- Work out OEE from availability, performance and quality, with each product's ideal cycle time brought in by XLOOKUP.
- Total downtime by cause and line, and show the main causes in a Pareto chart.
- Track scrap and rework by product and month with PivotTables, slicers and PivotCharts.
- Build a daily production dashboard with KPI cards, a combo chart of output against plan, a timeline and slicers by line.
- Record a macro that lays out the shift report, run it from a button and save the workbook as XLSM.
Projects
What you will build.
The course has 14 projects. These five matter most here.
-
Project 04
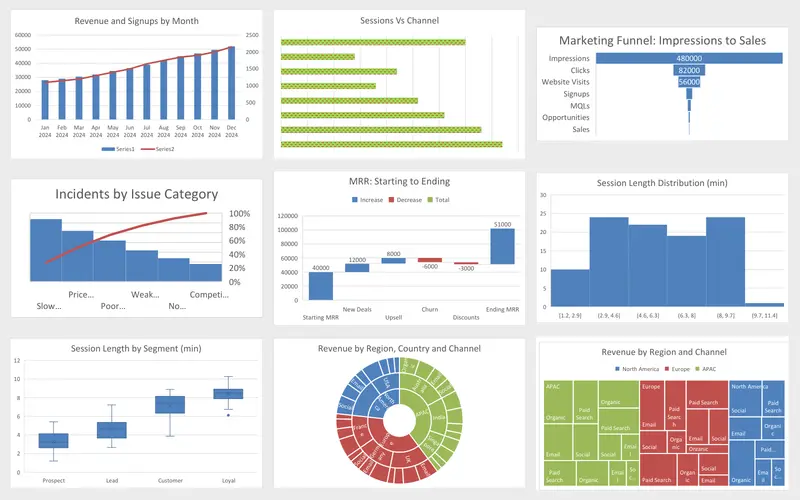
Marketing Engagement Dashboard
Nine charts, each picked for the question it answers.
A Pareto chart for downtime causes, a combo chart for output against plan and sparklines for each line's week.
-
Project 05
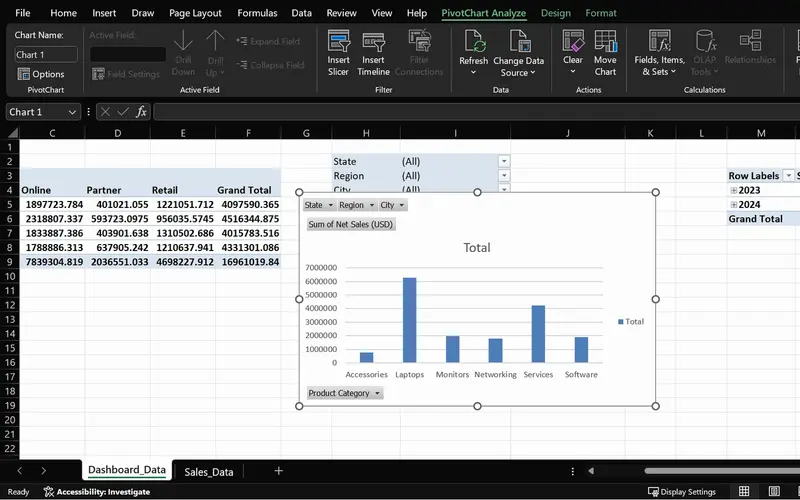
SalesPlusPerformance
A sales question answered in seconds, straight from the order data.
Output, scrap and rework by product and month from one table of shift records, with a slicer for each line.
-
Project 08
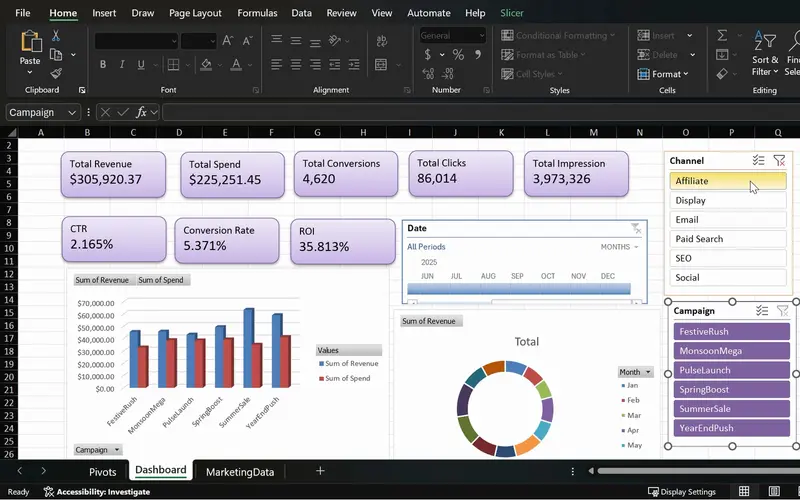
MarketPulse
One screen that shows which campaigns earn back their spend.
A daily production view: output, OEE and scrap as KPI cards, a timeline to pick the day or week, slicers for each line.
-
Project 11
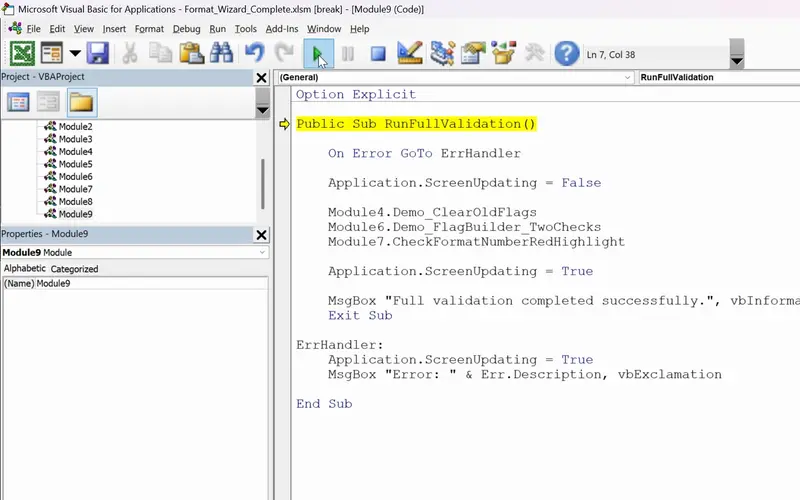
FormatWizard
One click that checks a whole sheet for you.
Only its recorded-macro start is on this page: the layout steps of your own shift report, recorded once and replayed from a button.
-
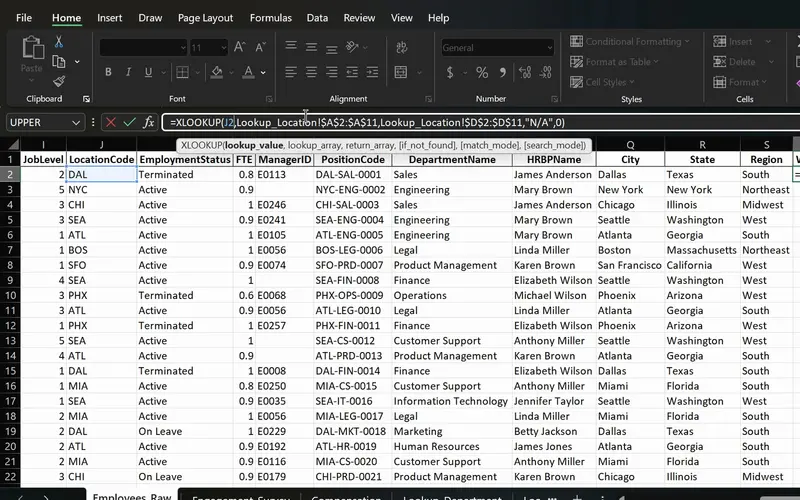
Project 06
PeopleInsight HR workbook
Employee data joined across sheets with one formula.
The lookups behind OEE: each product's ideal cycle time or standard rate fetched by product code from a separate list.
Lessons
The lessons that matter, in course order.
The Complete Excel Course with AI Integration has 186 lessons. This page picks out 45 of them, 3 h 23 min of video. Each lesson keeps its number in the course.
Where to start
Lesson 10 Relative vs absolute references in Excel
Begin at Lesson 10 if you can enter data and total a column: output against plan and OEE start with percentages and fixed references. New to Excel? Begin at Lesson 1. If SUMIFS and PivotTables are already familiar, go to Lesson 55 for the Pareto chart, or to Lesson 136, where recorded macros begin.
45 of 186 lessons · 3 h 23 min
01 Microsoft Excel fundamentals: building a foundation from scratch Output as a percentage of plan, OEE as a product of three percentages, a target held in one cell with an absolute reference, and IFERROR for a shift with no planned time. The lessons build a personal budget.
- 10 Start here Relative vs absolute references in Excel Dollar signs and mixed references 3 min
- 11 Calculating percentages in Excel Each expense as a percentage of income 2 min
- 12 Common Excel errors and how to fix them DIV0, NAME, VALUE errors and IFERROR 4 min
04 Essential formulas and functions (IF, SUMIF and more) IF and IFS to mark a shift below plan or label a line's result, AND and OR for checks with two conditions, then SUMIFS and COUNTIFS for output, scrap and stoppages by shift, line and product. The lessons use sales data.
- 28 Logical functions in Excel TRUE and FALSE comparisons for beginners 5 min
- 29 The IF function in Excel Pass or fail results with a single condition 3 min
- 30 IF function practice in Excel Categorise sales data with IF formulas 6 min
- 31 Nested IF and IFS in Excel Customer value tiers with nested IF 6 min
- 32 Nested IF and IFS in Excel Sales performance labels with the IFS function 5 min
- 33 AND and OR with IF in Excel Flag high-value deals with multiple conditions 8 min
- 34 SUM, COUNT and COUNTA in Excel SUM with FILTER and counting numbers with COUNT 7 min
- 35 SUM, COUNT and COUNTA in Excel COUNTA, unique counts and completeness checks 4 min
- 36 SUMIF and COUNTIF in Excel Conditional sum and count with one criterion 8 min
- 37 SUMIFS and COUNTIFS in Excel Sum and count with multiple criteria 7 min
06 Data visualisation: charts and graphs Charts for the shop floor: columns for output by line, a combo chart of output against plan, a line for a rate over the week, sparklines beside each line, and a Pareto chart of downtime causes.
- 48 Choosing the right Excel chart Column, line, pie, combo and modern chart types 4 min
- 49 Column charts in Excel Insert, format and label a column chart 5 min
- 50 Line charts in Excel Show trends over time with a line chart 4 min
- 51 Pie charts in Excel Show proportions and parts of a whole 4 min
- 52 Combo charts in Excel Column and line chart with a secondary axis 4 min
- 53 Formatting charts in Excel Titles, data labels, colours and chart styles 7 min
- 54 Sparklines in Excel Line, column and win-loss mini charts in cells 5 min
- 55 Funnel, Pareto and waterfall charts in Excel Modern charts for business data 5 min
07 PivotTables and PivotCharts: data analysis made easy PivotTables over production records: output, scrap and rework by product, line and month, grouping by date, slicers and PivotCharts. The lessons use sales orders.
- 57 PivotTables 101 in Excel What a PivotTable does and the sales dataset 5 min
- 58 Preparing data for PivotTables Clean data with TRIM, PROPER, find and replace 5 min
- 59 Create your first PivotTable in Excel Insert a PivotTable from a sales table 1 min
- 60 PivotTable fields in Excel Rows, values, columns and Value Field Settings 2 min
- 61 PivotTable summaries in Excel Sales by product category and grouping by date 4 min
- 62 Slicers in Excel Filter PivotTables with clickable buttons 3 min
- 63 PivotCharts in Excel Create interactive charts from a PivotTable 5 min
- 64 PivotTable design Tab Report layouts, PivotTable styles and number formats 5 min
- 65 Refresh a PivotTable in Excel Update pivots when source data changes 2 min
- 66 Excel Ninja Challenge PivotTable sales by region, category and monthly trend 1 min
08 Advanced Excel functions: lookups, text and arrays XLOOKUP, VLOOKUP and INDEX and MATCH bring each product's standard rate or ideal cycle time onto the shift sheet, with IFERROR for a product missing from the list. The lessons look up employee data.
- 67 Lookup functions in Excel The PeopleInsight HR dataset and why lookups matter 2 min
- 68 VLOOKUP in Excel Find employee data across sheets with exact match 4 min
- 69 XLOOKUP in Excel Exact match, if not found and two-way lookup 6 min
- 70 IFERROR in Excel Handle lookup errors in VLOOKUP and XLOOKUP formulas 3 min
- 71 INDEX and MATCH in Excel A flexible alternative to VLOOKUP 6 min
11 MarketPulse campaign intelligence dashboard The finish of the MarketPulse dashboard: PivotCharts and a timeline, KPI cards, slicers and final formatting. Built on campaign data, the same steps give a daily production screen.
- 111 Marketing charts and a timeline in Excel MarketPulse dashboard PivotCharts 4 min
- 112 KPI cards in Excel Marketing KPI cards for the MarketPulse dashboard 7 min
- 113 Slicers for an Excel dashboard Interactive filtering in MarketPulse 4 min
- 114 Polish an Excel marketing dashboard Final formatting and insights in MarketPulse 9 min
14 VBA and macros in Excel: FormatWizard Recorded macros: record the steps of a report, make them follow the active cell with relative references, run them from a button or the toolbar, and save a macro-enabled workbook.
- 136 Excel macros and VBA for beginners What macros are, the FormatWizard project 3 min
- 137 Record your first Excel macro Name, run and use absolute references 6 min
- 138 Relative references in Excel macros Make recorded macros dynamic 4 min
- 139 Developer Tab in Excel Run macros from a button and the quick access toolbar 4 min
- 140 Save macros in Excel Macro-enabled workbooks and the XLSM file format 3 min
Instructors
Who teaches it.

Instructor, Excel with AI
Virginia Thorn
Emmy Award winner. Teaches Excel with AI at Coding Liquids.
Questions
Asked before starting.
Is there an Excel course for production managers and supervisors?
Yes. The Complete Excel Course with AI Integration from Coding Liquids teaches the Excel a production report uses: output against plan by shift, line and product with SUMIFS, OEE worked out from availability, performance and quality, downtime causes in a Pareto chart, scrap and rework in PivotTables, a daily dashboard with KPI cards, and a recorded macro that lays out the shift report. The 45 lessons on this page take 3 hours 23 minutes.
Can I calculate OEE in Excel with what the course teaches?
Yes, from three ratios built with formulas in The Complete Excel Course with AI Integration: availability as run time over planned time, performance from the ideal cycle time that XLOOKUP brings in by product, and quality as good units over total units, multiplied together and shown as a percentage. IFERROR covers a shift that never ran. There is no OEE lesson as such; these are the percentage, lookup and error lessons at work.
How do I find the main causes of downtime?
Log each stoppage with its line, cause and length, then use what The Complete Excel Course with AI Integration teaches: SUMIFS or a PivotTable totals the time lost by cause, and the Pareto chart in Lesson 55 puts the causes in order with a cumulative line, so the few behind most of the lost time stand out. Slicers narrow the view to one line or shift.
Can a macro produce the shift report for me?
A recorded one can repeat the steps you take each shift. The Complete Excel Course with AI Integration shows how to record a macro, make it follow the active cell with relative references, run it from a button and save the workbook as XLSM. Record the sorting, filtering and formatting of the shift report once and a click repeats them. Writing VBA by hand comes later in the course and is not on this page.
Does the course teach lean, SPC or an MES?
No. The Complete Excel Course with AI Integration teaches Excel, not production management. Lean methods, statistical process control and manufacturing execution systems are not taught. Its lessons apply to the figures those systems and shift sheets produce once they are in Excel: output against plan, downtime, OEE, scrap and the daily report.
Excel with AI
See the whole course.
The Complete Excel Course with AI Integration: 16 hours of video in 186 lessons, built around 14 projects, with lifetime access, a Certificate of Completion and a 14-day money-back guarantee.
The same course
For another job, level or topic.
By job
Finance and accounting
- Accountants and finance teams
- Bookkeepers and accounts assistants
- FP&A and budget analysts
- Auditors and fraud examiners
- Payroll administrators
- Tax accountants and advisers
- Banking professionals
- Cost and management accountants
- Financial controllers
- Credit control and receivables teams
- Accounts payable teams
- Financial planners and advisers
- Credit analysts and loan officers
- Insurance underwriters
- Insurance claims handlers
- Reconciliation analysts
- Treasury analysts
- Medical billing and coding specialists
- Fund accountants
- Billing administrators
- AML and KYC analysts
- Actuarial analysts
- Insurance agents and brokers
HR and office administration
Operations and supply chain
- Operations and project managers
- Procurement and purchasing officers
- Logistics coordinators
- Inventory controllers and storekeepers
- Supply chain analysts
- Warehouse managers and supervisors
- PMO analysts
- Import and export coordinators
- Production planners
- Demand planners
- Fleet and transport managers
- Apparel merchandisers