



The Complete Excel Course with AI Integration
Excel course for MIS and reporting analysts
For MIS executives and reporting analysts who turn system exports into daily, weekly and monthly reports in Excel. This page picks out the parts of The Complete Excel Course with AI Integration that this work runs on: SUMIFS and COUNTIFS, PivotTables with slicers, lookups across sheets, Power Query and a Power Pivot data model for exports that arrive every day, VBA that checks a sheet, and Power Automate Desktop for the routine.
Taught by Sagnik Bhattacharya and Virginia Thorn

What you will be able to do
At work, you will be able to:
- Turn a folder of daily or monthly system exports into one clean table with Power Query, and refresh the report in one click when new files arrive.
- Bring fields together from several sheets with VLOOKUP, XLOOKUP or INDEX and MATCH, with IFERROR for codes that do not match.
- Summarise by region, product, team and month with PivotTables, slicers and PivotCharts, and with SUMIFS and COUNTIFS where a report keeps a fixed layout.
- Record a report's formatting as a macro, and write VBA that checks a sheet for blanks and non-numeric amounts before it goes out.
- Hand the weekly routine to a Power Automate Desktop flow that opens the workbook, reads the rows and writes the result back.
- Check a report against its source: record counts with COUNTA, totals with SUMIFS, and a Group By summary in Power Query.
Projects
What you will build.
The course has 14 projects. These five matter most here.
-
Project 12
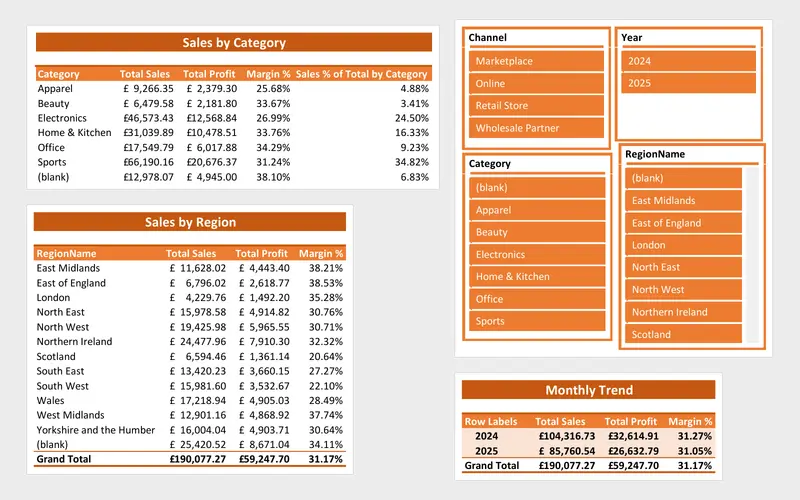
SalesFusion
A sales report that refreshes itself from a folder of files.
The daily export routine replaced: each new file dropped into the folder joins the table on Refresh, cleaned, typed and merged with its lookups, ready for the model and the report.
-
Project 05
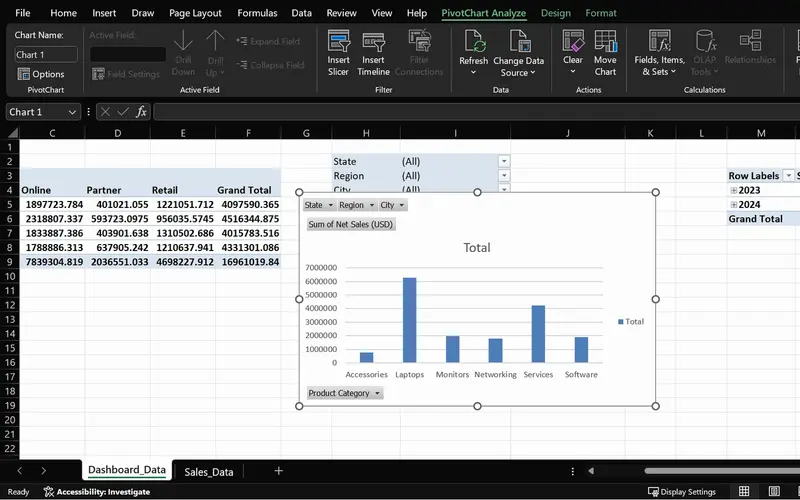
SalesPlusPerformance
A sales question answered in seconds, straight from the order data.
Region, product and month on demand: the PivotTable habits behind a routine MIS summary, with slicers so a manager can pick their own view.
-
Project 06
PeopleInsight HR workbook
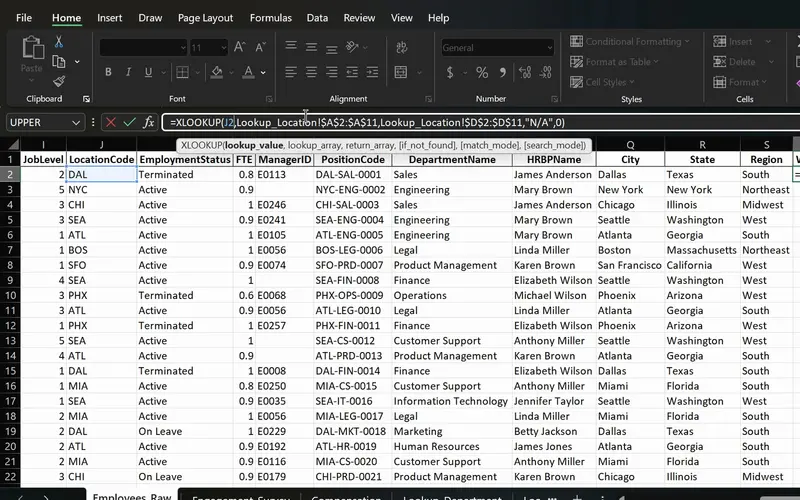
Employee data joined across sheets with one formula.
Fields from several sheets brought into one report with VLOOKUP, XLOOKUP and INDEX and MATCH, and IFERROR so a missing code shows a clear note, practised on an HR dataset.
-
Project 11
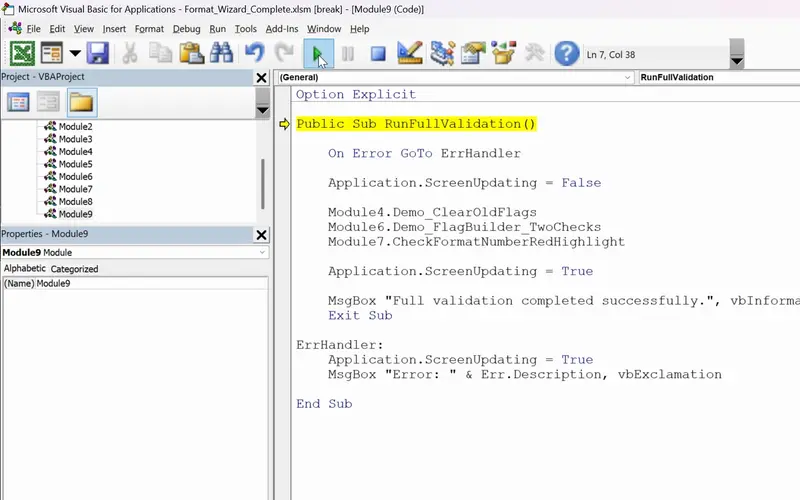
FormatWizard
One click that checks a whole sheet for you.
Checks before a report goes out: a macro that formats the sheet the same way each time, then VBA that flags missing values and amounts that are not numbers.
-
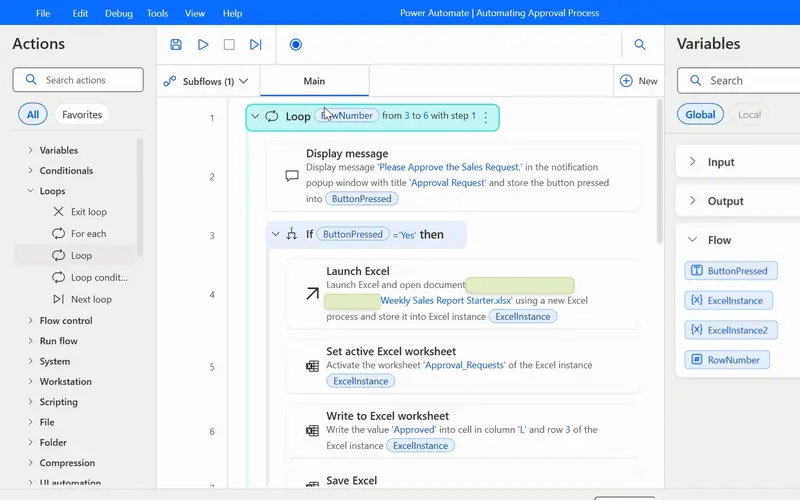
Project 13
AutoFlow
The weekly report routine, run by a flow instead of by you.
The repeat steps of a reporting week handed to Power Automate Desktop: open the workbook, read the rows, loop through them with a condition and write the result back.
Lessons
The lessons that matter, in course order.
The Complete Excel Course with AI Integration has 186 lessons. This page picks out 76 of them, 6 h 8 min of video. Each lesson keeps its number in the course.
Where to start
Lesson 34 SUM, COUNT and COUNTA in Excel
Begin at Lesson 34 if you already enter data and write simple formulas: MIS totals start with COUNT and SUMIFS. New to Excel? Begin at Lesson 1. If SUMIFS, PivotTables and VLOOKUP are already part of your day, go to Lesson 136, where the automation half of this path begins with macros and VBA, followed by Power Query and Power Automate.
76 of 186 lessons · 6 h 8 min
04 Essential formulas and functions (IF, SUMIF and more) The totals an MIS report is built from, and the checks on them: COUNT and COUNTA for record counts and completeness, then SUMIF, COUNTIF, SUMIFS and COUNTIFS for totals by region, product or team that you can tie back to the source.
- 34 Start here SUM, COUNT and COUNTA in Excel SUM with FILTER and counting numbers with COUNT 7 min
- 35 SUM, COUNT and COUNTA in Excel COUNTA, unique counts and completeness checks 4 min
- 36 SUMIF and COUNTIF in Excel Conditional sum and count with one criterion 8 min
- 37 SUMIFS and COUNTIFS in Excel Sum and count with multiple criteria 7 min
07 PivotTables and PivotCharts: data analysis made easy SalesPlusPerformance: PivotTables from order-level data, grouped by date, filtered with slicers, charted with PivotCharts, styled with report layouts and refreshed when the export changes.
- 57 PivotTables 101 in Excel What a PivotTable does and the sales dataset 5 min
- 58 Preparing data for PivotTables Clean data with TRIM, PROPER, find and replace 5 min
- 59 Create your first PivotTable in Excel Insert a PivotTable from a sales table 1 min
- 60 PivotTable fields in Excel Rows, values, columns and Value Field Settings 2 min
- 61 PivotTable summaries in Excel Sales by product category and grouping by date 4 min
- 62 Slicers in Excel Filter PivotTables with clickable buttons 3 min
- 63 PivotCharts in Excel Create interactive charts from a PivotTable 5 min
- 64 PivotTable design Tab Report layouts, PivotTable styles and number formats 5 min
- 65 Refresh a PivotTable in Excel Update pivots when source data changes 2 min
- 66 Excel Ninja Challenge PivotTable sales by region, category and monthly trend 1 min
08 Advanced Excel functions: lookups, text and arrays Lookups that bring fields together from several sheets (VLOOKUP, XLOOKUP, INDEX and MATCH, IFERROR for the gaps), LEFT, RIGHT and MID for system codes, EOMONTH and NETWORKDAYS for reporting dates, and UNIQUE, FILTER and SORT for lists that update themselves.
- 67 Lookup functions in Excel The PeopleInsight HR dataset and why lookups matter 2 min
- 68 VLOOKUP in Excel Find employee data across sheets with exact match 4 min
- 69 XLOOKUP in Excel Exact match, if not found and two-way lookup 6 min
- 70 IFERROR in Excel Handle lookup errors in VLOOKUP and XLOOKUP formulas 3 min
- 71 INDEX and MATCH in Excel A flexible alternative to VLOOKUP 6 min
- 72 CONCAT and TEXTJOIN in Excel Combine employee names and text with a delimiter 3 min
- 73 LEFT, RIGHT and MID in Excel Extract parts of a text code like DAL-SAL-0001 7 min
- 74 TODAY, EOMONTH and NETWORKDAYS in Excel Date calculations for HR data 5 min
- 75 UNIQUE function in Excel Extract a distinct list with dynamic arrays 6 min
- 76 FILTER function in Excel Dynamic array filtering with AND and OR criteria 5 min
- 77 SORT and SORTBY in Excel Sort data dynamically with formulas 4 min
- 78 Excel Ninja Challenge XLOOKUP, totals and text concatenation lookup challenge 3 min
14 VBA and macros in Excel: FormatWizard FormatWizard: record a formatting macro and run it from a button, then write VBA with variables, If statements and loops that checks a sheet for missing regions and non-numeric amounts, with Debug.Print for testing and an error handler.
- 136 Excel macros and VBA for beginners What macros are, the FormatWizard project 3 min
- 137 Record your first Excel macro Name, run and use absolute references 6 min
- 138 Relative references in Excel macros Make recorded macros dynamic 4 min
- 139 Developer Tab in Excel Run macros from a button and the quick access toolbar 4 min
- 140 Save macros in Excel Macro-enabled workbooks and the XLSM file format 3 min
- 141 The VBA Editor in Excel Open it with Alt+F11 and learn the workspace 4 min
- 142 Working in the VBA editor Macro security, trust settings, switching to Excel 6 min
- 143 Your first VBA code Modules, worksheets, rows, columns and formatting 4 min
- 144 VBA variables and data types Sub vs function for Excel beginners 6 min
- 145 VBA functions in Excel Build GetLastUsedRow with find and exit function 5 min
- 146 Clear old flags with VBA Reset messages and fill colours with if statements 5 min
- 147 For Next loop in VBA Flag missing region values in Excel 4 min
- 148 VBA If Else and loops Check missing sales data and build a FlagText message 5 min
- 149 Highlight cells with VBA Interior.Color and RGB for missing data 5 min
- 150 IsNumeric in VBA Validate unit price and amount data types in Excel 7 min
- 151 Debugging VBA for beginners Debug.Print and the Immediate window 5 min
- 152 Complete Excel validation macro One VBA subroutine with an error handler 3 min
15 SalesFusion: advanced data tools and a Power Query modelling system SalesFusion: Power Query imports CSV files, cleans and types them, merges lookups, appends history and combines a whole folder, Power Pivot relates the tables, and DAX measures feed a PivotTable report and a dashboard. The Power Pivot lessons need Excel for Windows.
- 153 SalesFusion Power Query project Excel ETL pipeline and data model overview 5 min
- 154 Introduction to Power Query in Excel The ETL workflow explained 5 min
- 155 Import a CSV with Power Query Get data from text and transform data 2 min
- 156 Clean columns in Power Query Remove and rename columns for modelling 5 min
- 157 Clean text in Power Query Trim, clean, replace values and fix text case 6 min
- 158 Data types in Power Query Fix date, whole number, decimal and text types 7 min
- 159 Date columns in Power Query Add year, month and year-month fields for reports 7 min
- 160 Business logic in Power Query Custom and conditional columns for profitability 6 min
- 161 Group By in Power Query Summarise sales by month and region to validate data 5 min
- 162 Close and Load in Power Query Connection only, table or Data Model 5 min
- 163 Merge queries in Power Query Look up product and region names with a left join 5 min
- 164 Reuse a Power Query pipeline Duplicate queries for a new year of sales data 5 min
- 165 Append queries in Power Query Combine 2024 and 2025 sales tables 3 min
- 166 From Folder in Power Query Combine every sales file in a folder automatically 9 min
- 167 From Folder automation in Power Query Profit metrics and fiscal year columns 7 min
- 168 Build a sales fact table in Power Query Merge lookups and append history 6 min
- 169 Power Pivot Data Model in Excel Relationships and Diagram View 6 min
- 170 DAX measures in Power Pivot Total sales, margin percent and percent of total 10 min
- 171 PivotTable report from the Data Model Format the SalesFusion report in Excel 5 min
- 172 Interactive Excel dashboard Data model PivotTables, slicers and styling 10 min
- 173 Unpivot columns in Power Query Turn wide month columns into a long table 8 min
16 Power Automate: weekly sales report automation AutoFlow: Power Automate Desktop flows that launch Excel, read worksheet data, loop through rows, ask for approval and write results back, built from a template, with the recorder or from scratch, and run from a shortcut. Power Automate Desktop needs Windows.
- 174 Power Automate Desktop for Excel Set up AutoFlow and your first automation 3 min
- 175 Your first Power Automate flow Flows, triggers, actions and Display message 3 min
- 176 Connect Excel to Power Automate Launch Excel and the Excel instance variable 3 min
- 177 Copilot Vision with Power Automate AI-guided help while you build a flow 2 min
- 178 Read data from Excel with Power Automate Read from worksheet and close Excel 4 min
- 179 Power Automate templates Search and replace Excel values template walkthrough 7 min
- 180 Run Power Automate flows From a desktop shortcut and a run URL 3 min
- 181 Power Automate Desktop recorder Record desktop and browser actions into a flow 4 min
- 182 Action properties in Power Automate UI elements, variables and wait settings 4 min
- 183 Approval flow in Power Automate Desktop If conditions and message box buttons 9 min
- 184 Loops in Power Automate Desktop Loop and For each actions for Excel rows 5 min
- 185 Power Automate Ninja Challenge Flag onboarded rows with loop, read, if, write 5 min
Instructors
Who teaches it.

Instructor, Excel with AI
Virginia Thorn
Emmy Award winner. Teaches Excel with AI at Coding Liquids.
Questions
Asked before starting.
Is there an Excel course for MIS executives and reporting analysts?
Yes. The Complete Excel Course with AI Integration from Coding Liquids covers the Excel side of MIS reporting: SUMIFS and COUNTIFS totals, PivotTables with slicers, VLOOKUP, XLOOKUP and INDEX and MATCH, a Power Query report that rebuilds itself from a folder of exports, VBA checks and a Power Automate Desktop flow. The 76 lessons on this page come to 6 hours 8 minutes of the course's 16 hours.
Can I automate a daily MIS report in Excel?
Large parts of it, yes. With what The Complete Excel Course with AI Integration teaches, Power Query reloads a folder of daily exports into one cleaned table on Refresh, so the PivotTables and DAX measures built on it update together. A VBA macro then checks the result for blanks and amounts that are not numbers, and a Power Automate Desktop flow, started from a desktop shortcut, opens the workbook and works through the rows.
How do I check an MIS report against the source data?
The Complete Excel Course with AI Integration gives you several checks. COUNTA and unique counts confirm the number of records matches the export, SUMIFS rebuilds a total by region or month to set beside the report's figure, and Group By in Power Query summarises the source by month and region to validate a load. The VBA macro of FormatWizard then flags blanks and amounts that are not numbers.
How much VBA does the course teach?
A beginner's route that ends in a working validation macro. In FormatWizard, part of The Complete Excel Course with AI Integration, you record macros and run them from a button, then write VBA with variables, If statements and For Next loops that flags missing regions, tests amounts with IsNumeric, colours problem cells with RGB, and uses Debug.Print and an error handler.
Does the course cover SQL, Power BI or database work?
No. The Complete Excel Course with AI Integration teaches Excel, so SQL, Power BI and database administration are not covered. It starts from what an MIS role receives: exports and CSV files from the system, which Power Query cleans and combines and the report then draws on.
Excel with AI
See the whole course.
The Complete Excel Course with AI Integration: 16 hours of video in 186 lessons, built around 14 projects, with lifetime access, a Certificate of Completion and a 14-day money-back guarantee.
The same course
For another job, level or topic.
By job
Finance and accounting
- Accountants and finance teams
- Bookkeepers and accounts assistants
- FP&A and budget analysts
- Auditors and fraud examiners
- Payroll administrators
- Tax accountants and advisers
- Banking professionals
- Cost and management accountants
- Financial controllers
- Credit control and receivables teams
- Accounts payable teams
- Financial planners and advisers
- Credit analysts and loan officers
- Insurance underwriters
- Insurance claims handlers
- Reconciliation analysts
- Treasury analysts
- Medical billing and coding specialists
- Fund accountants
- Billing administrators
- AML and KYC analysts
- Actuarial analysts
- Insurance agents and brokers
HR and office administration
Operations and supply chain
- Operations and project managers
- Procurement and purchasing officers
- Logistics coordinators
- Inventory controllers and storekeepers
- Supply chain analysts
- Warehouse managers and supervisors
- PMO analysts
- Import and export coordinators
- Production planners
- Demand planners
- Fleet and transport managers
- Apparel merchandisers
Data and reporting
Sales, marketing and customer service
Business and management
Engineering, construction and manufacturing
- Quantity surveyors and estimators
- Civil and site engineers
- Quality managers and engineers
- Construction project managers
- Health and safety officers
- Document controllers
- Production managers and supervisors
- Mechanical and electrical engineers
- Industrial engineers
- Planning engineers
- Sustainability and ESG analysts
- Maintenance planners