



The Complete Excel Course with AI Integration
Excel course for executive assistants and PAs
Personal assistants and executive assistants rely on Excel to handle meeting actions, track office budgets, process expenses and assemble management pack figures. This page picks out the parts of The Complete Excel Course with AI Integration that this work draws on: TaskFlow as an action tracker, formulas for conditional totals, cross-sheet lookups, reporting charts, budget comparison in FinanceGuard, and the AI lessons.
Taught by Sagnik Bhattacharya and Virginia Thorn

What you will be able to do
At work, you will be able to:
- Run a meeting action log for an executive using drop-down menus for priority and status, conditional formatting to flag late items, NETWORKDAYS for remaining business days, and cell protection for shared workbooks.
- Calculate monthly and categorical totals for office expenses and claims via SUMIFS, comparing these figures to the budget using variance and percentage variance.
- Consolidate data from multiple sheets into a unified summary table using XLOOKUP or INDEX and MATCH, handling missing records cleanly with IFERROR.
- Select and format clear visuals for management packs, including line, column, pie and combo charts, in-cell sparklines, and legible data labels.
- Draft formulas, data summaries and charts with Copilot, ChatGPT or Claude, applying a quality assurance checklist to review results before briefing an executive.
Projects
What you will build.
The course has 14 projects. These four matter most here.
-
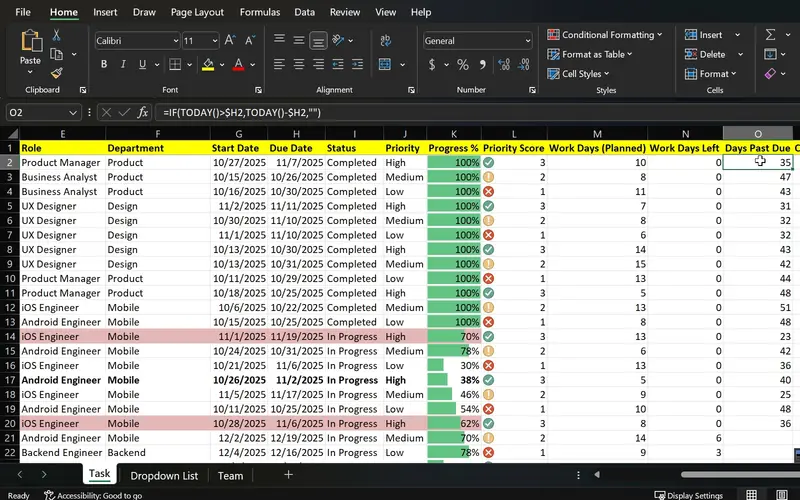
Project 07
TaskFlow
One sheet that shows what is done, what is late and what is urgent.
Built for tasks, it serves as a shared tracker for executive meeting actions, featuring status drop-downs, target dates, highlighted delays, and locked formula cells that prevent accidental changes during colleague updates.
-
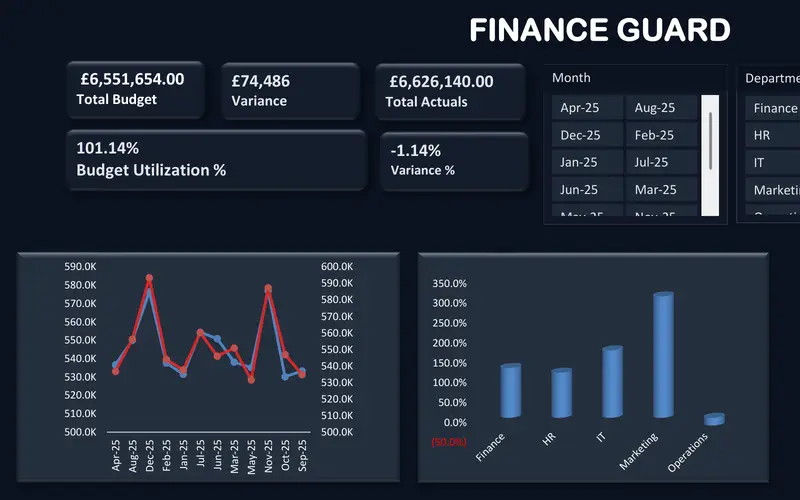
Project 09
FinanceGuard
The budget vs actual report finance teams send every month.
Manage office spending against targets across individual line items, marking overspends in distinct colours and giving executives interactive slicers to filter the figures.
-
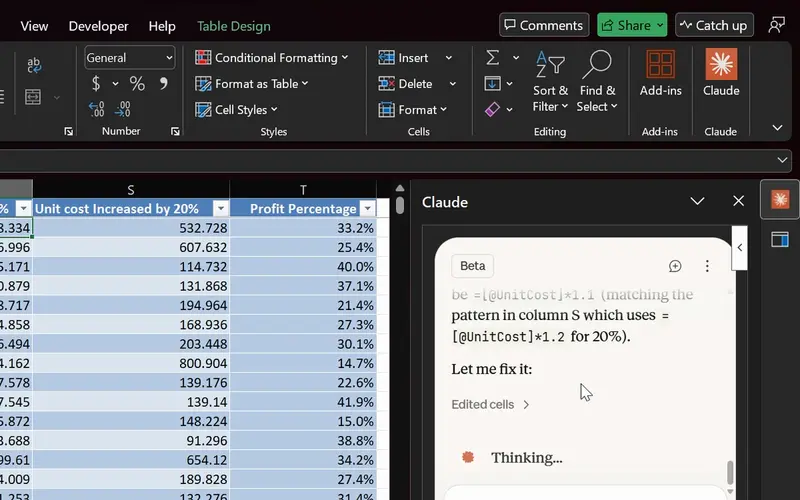
Project 14
Agentic AI in Excel
AI finds and fixes the formula; you check it before it counts.
Produce initial charts and written summaries for leadership via ChatGPT, Copilot or Claude, using a structured verification checklist to vet content before sharing.
-
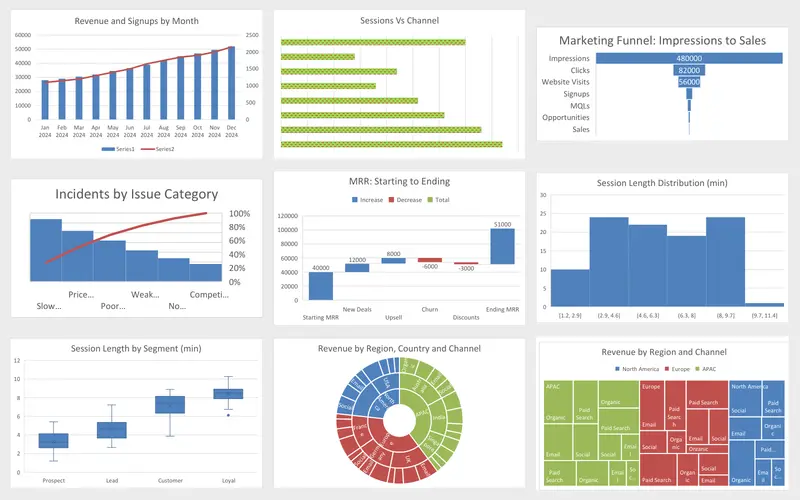
Project 04
Marketing Engagement Dashboard
Nine charts, each picked for the question it answers.
Practise matching report figures to suitable visuals using marketing metrics, illustrating trends with line graphs, proportions with pie charts, and dual measures with combo charts.
Lessons
The lessons that matter, in course order.
The Complete Excel Course with AI Integration has 186 lessons. This page picks out 61 of them, 5 h 5 min of video. Each lesson keeps its number in the course.
Where to start
Lesson 36 SUMIF and COUNTIF in Excel
Start at Lesson 36 if entering data and calculating a column sum with SUM are already familiar to you. Those completely new to spreadsheets should start at Lesson 1; the course builds foundational skills step by step from there towards this stage. If your routine already includes building charts, writing lookups and calculating conditional sums, jump ahead to Lesson 79 to start TaskFlow and advance into the AI material.
61 of 186 lessons · 5 h 5 min
04 Essential formulas and functions (IF, SUMIF and more) Aggregate office budgets and staff expense submissions across months and categories using SUMIF and SUMIFS, count occurrences with COUNTIF and COUNTIFS, and manage scheduling deadlines or travel dates through date arithmetic alongside TODAY and MONTH.
- 36 Start here SUMIF and COUNTIF in Excel Conditional sum and count with one criterion 8 min
- 37 SUMIFS and COUNTIFS in Excel Sum and count with multiple criteria 7 min
- 38 The Excel function library Insert Function dialog and Formula AutoComplete 5 min
- 39 Date and time functions in Excel TODAY, NOW, MONTH and date arithmetic 6 min
06 Data visualisation: charts and graphs Construct clear management or board pack visualisations by selecting appropriate graph styles for specific questions, using line, column, combo and pie charts, legible titles and data labels, in-cell sparklines, plus funnel and waterfall charts for business metrics.
- 48 Choosing the right Excel chart Column, line, pie, combo and modern chart types 4 min
- 49 Column charts in Excel Insert, format and label a column chart 5 min
- 50 Line charts in Excel Show trends over time with a line chart 4 min
- 51 Pie charts in Excel Show proportions and parts of a whole 4 min
- 52 Combo charts in Excel Column and line chart with a secondary axis 4 min
- 53 Formatting charts in Excel Titles, data labels, colours and chart styles 7 min
- 54 Sparklines in Excel Line, column and win-loss mini charts in cells 5 min
- 55 Funnel, Pareto and waterfall charts in Excel Modern charts for business data 5 min
- 56 Histogram, box and whisker, treemap and sunburst Advanced Excel chart types 6 min
08 Advanced Excel functions: lookups, text and arrays Bring numbers across various sheets into a single overview with INDEX and MATCH, VLOOKUP or XLOOKUP, handle missing values with IFERROR, determine workdays remaining before deadlines via NETWORKDAYS, and isolate specific team records using FILTER and SORT, all demonstrated on an HR dataset.
- 67 Lookup functions in Excel The PeopleInsight HR dataset and why lookups matter 2 min
- 68 VLOOKUP in Excel Find employee data across sheets with exact match 4 min
- 69 XLOOKUP in Excel Exact match, if not found and two-way lookup 6 min
- 70 IFERROR in Excel Handle lookup errors in VLOOKUP and XLOOKUP formulas 3 min
- 71 INDEX and MATCH in Excel A flexible alternative to VLOOKUP 6 min
- 72 CONCAT and TEXTJOIN in Excel Combine employee names and text with a delimiter 3 min
- 73 LEFT, RIGHT and MID in Excel Extract parts of a text code like DAL-SAL-0001 7 min
- 74 TODAY, EOMONTH and NETWORKDAYS in Excel Date calculations for HR data 5 min
- 75 UNIQUE function in Excel Extract a distinct list with dynamic arrays 6 min
- 76 FILTER function in Excel Dynamic array filtering with AND and OR criteria 5 min
- 77 SORT and SORTBY in Excel Sort data dynamically with formulas 4 min
- 78 Excel Ninja Challenge XLOOKUP, totals and text concatenation lookup challenge 3 min
09 Project: task automation with data validation and forms Construct TaskFlow, built here for project tasks and just as fit for tracking meeting actions: drop-down selectors for priority and status, overdue task highlights, a due-date timeline, calculations of remaining days, and locked formula cells so a shared sheet keeps its formulas.
- 79 TaskFlow project tracker in Excel Overview of the task tracker dashboard 4 min
- 80 Designing a task tracker in Excel TaskFlow layout, columns and headers 5 min
- 81 Data validation in Excel Status and priority drop-down lists in TaskFlow 8 min
- 82 Conditional formatting in Excel Highlight overdue and completed tasks 8 min
- 83 Gantt chart in Excel Build a project timeline with conditional formatting 6 min
- 84 Data bars and icon sets in Excel Visual priority and progress in TaskFlow 6 min
- 85 NETWORKDAYS and TODAY in Excel Days remaining and task deadlines in TaskFlow 5 min
- 86 Protect a sheet and lock cells in Excel Secure the TaskFlow tracker workbook 4 min
- 87 Testing an Excel task tracker Stress test TaskFlow with sample data 3 min
10 Boosting productivity with AI in Excel (Copilot, ChatGPT and Claude) Work safely with AI through step-by-step checks: structure tables properly for Copilot, prompt it for formula columns, charts, PivotTables or an executive summary, verify outputs with a QA checklist, outline analytical plans in ChatGPT, and explore Claude in Excel, Microsoft Stride and the COPILOT function.
- 88 AI in Excel What Copilot, ChatGPT and Claude can and cannot do 8 min
- 89 Prepare data for Copilot in Excel Tables, headers and clean structure 6 min
- 90 Copilot executive summary in Excel Summarise a dataset in seconds with AI 5 min
- 91 Copilot prompts for Excel Weak vs strong prompts and the PRO prompt pattern 5 min
- 92 PivotTables with Copilot Build an Excel PivotTable from a prompt 5 min
- 93 Charts with Copilot and ChatGPT Create and choose the right Excel chart 6 min
- 94 Conditional formatting with Copilot and ChatGPT Highlight problems in Excel 4 min
- 95 Excel formulas with AI Copilot and ChatGPT write formula columns you verify 6 min
- 96 Find outliers with Copilot in Excel Discounts, negative profit, suspect rows 7 min
- 97 Clean messy data with Copilot in Excel AI prompts plus Excel functions 4 min
- 98 Mini dashboard with Copilot in Excel KPIs, charts and slicers on one page 3 min
- 99 Check AI output in Excel A quick QA checklist for Copilot results 2 min
- 100 ChatGPT as your analysis planner Plan an Excel analysis before you build it 3 min
- 101 COPILOT function in Excel Use Copilot as a formula inside your cells 4 min
- 102 Copilot guided help in Excel Step-by-step AI help inside Excel 3 min
- 103 Microsoft Stride for Excel The Office Agent that builds workbooks for you 4 min
- 104 Claude in Excel Analyse data and build spreadsheets with Claude 7 min
12 Project: FinanceGuard budget variance analyser (budget vs actual Excel dashboard) Build FinanceGuard to compare actuals against planned figures, organising separate tables for budget and actual expenditure, calculating coloured variance and percentage variance via dynamic arrays and SUMIFS, and finishing with KPI cards, a combo chart and slicers. An executive office budget fits the same model.
- 115 FinanceGuard budget vs actual dashboard Excel project overview 3 min
- 116 Excel tables for budget and actual data Organise the FinanceGuard datasets 4 min
- 117 Budget vs actual model in Excel SORT, UNIQUE, VSTACK, LET, TEXTSPLIT, SUMIFS 8 min
- 118 Budget variance in Excel Calculate variance and percent variance 4 min
- 119 Custom number formats in Excel Show budget variances with colours and signs 2 min
- 120 PivotTables for budget vs actual The FinanceGuard pivot workspace 8 min
- 121 KPI cards in Excel Summary cards for a budget variance dashboard 4 min
- 122 Budget vs actual charts in Excel Combo chart with secondary axis for variance 5 min
- 123 Slicers and PivotCharts in Excel Interactive FinanceGuard budget dashboard 4 min
- 124 Finish the FinanceGuard dashboard in Excel Final polish and variance insights 10 min
Instructors
Who teaches it.

Instructor, Excel with AI
Virginia Thorn
Emmy Award winner. Teaches Excel with AI at Coding Liquids.
Questions
Asked before starting.
Is there an Excel course for executive assistants and personal assistants?
Yes. The Complete Excel Course with AI Integration from Coding Liquids covers the spreadsheet skills required to run an executive office: an action tracker with overdue highlights in TaskFlow, a budget versus actual report in FinanceGuard, visual charts for management packs, lookups across sheets to combine numbers, and summaries drafted by AI that you check. Completing the 61 lessons on this page takes 5 hours 5 minutes of the course's 16 hours.
Can an executive assistant use this training to prepare figures for a board pack?
For the spreadsheet portion, yes. In The Complete Excel Course with AI Integration, you learn to assemble data across sheets with XLOOKUP, format appropriate chart types to address specific business questions, and build combo charts alongside KPI cards in FinanceGuard. Laying out the pack in PowerPoint, minute-taking, and Outlook diary or inbox management are not taught.
How can a personal assistant track actions arising from an executive's meetings?
You can manage them using a tracker like TaskFlow, constructed step by step in The Complete Excel Course with AI Integration. Each action receives a row with its deadline, drop-down menus for status and priority, conditional formatting to mark overdue or completed items, NETWORKDAYS formulas to count days remaining, and locked cells that allow colleagues to supply updates safely. The project structure demonstrated for tasks applies cleanly to meeting actions.
Can an executive assistant manage expense claims and the office budget in Excel?
Yes. In The Complete Excel Course with AI Integration, SUMIFS calculates expenses by category and month, while the FinanceGuard project contrasts real expenditure with planned budgets. You calculate variance and percentage variance, highlight overspending in colour using custom number formats, and assemble a dashboard complete with slicers and KPI summary cards. The lessons compare a budget with actual spending, and an executive office budget fits into the same model.
Is the AI training relevant for an executive assistant or PA?
It is particularly valuable for producing initial drafts. Within The Complete Excel Course with AI Integration, Copilot generates table summaries for leadership, creates formula columns, and builds charts or PivotTables from natural prompts. ChatGPT assists in planning analyses before construction, and Claude carries out data analysis within Excel. Because accuracy is critical, lessons verify outputs at each stage and apply a QA checklist before any work is presented to an executive.
Excel with AI
See the whole course.
The Complete Excel Course with AI Integration: 16 hours of video in 186 lessons, built around 14 projects, with lifetime access, a Certificate of Completion and a 14-day money-back guarantee.
The same course
For another job, level or topic.
By job
Finance and accounting
- Accountants and finance teams
- Bookkeepers and accounts assistants
- FP&A and budget analysts
- Auditors and fraud examiners
- Payroll administrators
- Tax accountants and advisers
- Banking professionals
- Cost and management accountants
- Financial controllers
- Credit control and receivables teams
- Accounts payable teams
- Financial planners and advisers
- Credit analysts and loan officers
- Insurance underwriters
- Insurance claims handlers
- Reconciliation analysts
- Treasury analysts
- Medical billing and coding specialists
- Fund accountants
- Billing administrators
- AML and KYC analysts
- Actuarial analysts
- Insurance agents and brokers
HR and office administration
Operations and supply chain
- Operations and project managers
- Procurement and purchasing officers
- Logistics coordinators
- Inventory controllers and storekeepers
- Supply chain analysts
- Warehouse managers and supervisors
- PMO analysts
- Import and export coordinators
- Production planners
- Demand planners
- Fleet and transport managers
- Apparel merchandisers
Data and reporting
Sales, marketing and customer service
Business and management
Engineering, construction and manufacturing
- Quantity surveyors and estimators
- Civil and site engineers
- Quality managers and engineers
- Construction project managers
- Health and safety officers
- Document controllers
- Production managers and supervisors
- Mechanical and electrical engineers
- Industrial engineers
- Planning engineers
- Sustainability and ESG analysts
- Maintenance planners