



The Complete Excel Course with AI Integration
Excel course for clinical research coordinators
For clinical research coordinators and study site staff who keep logs, visit schedules and trackers in Excel. The Complete Excel Course with AI Integration has no trial data of its own; this page picks out the lessons a site's workbooks use: Excel Tables for logs, COUNTIFS and date arithmetic for enrolment and visit windows, charts against target, lookups by participant ID and the TaskFlow tracker for regulatory documents.
Taught by Sagnik Bhattacharya and Virginia Thorn

What you will be able to do
At work, you will be able to:
- Keep screening and deviation logs as Excel Tables keyed by participant ID, sorted, filtered and free of duplicate rows.
- Work out each visit's target date and window from the baseline with date arithmetic, and flag a visit outside its window with IF and OR.
- Count screened, enrolled and withdrawn participants by site with COUNTIFS, and chart cumulative enrolment against target.
- List the visits falling due in the coming week by site with FILTER and SORT.
- Track regulatory documents and start-up tasks, with expiry dates coloured as they lapse.
- Match site and participant payments to completed visits with XLOOKUP and IFERROR, and total them by site with SUMIFS.
Projects
What you will build.
The course has 14 projects. These four matter most here.
-
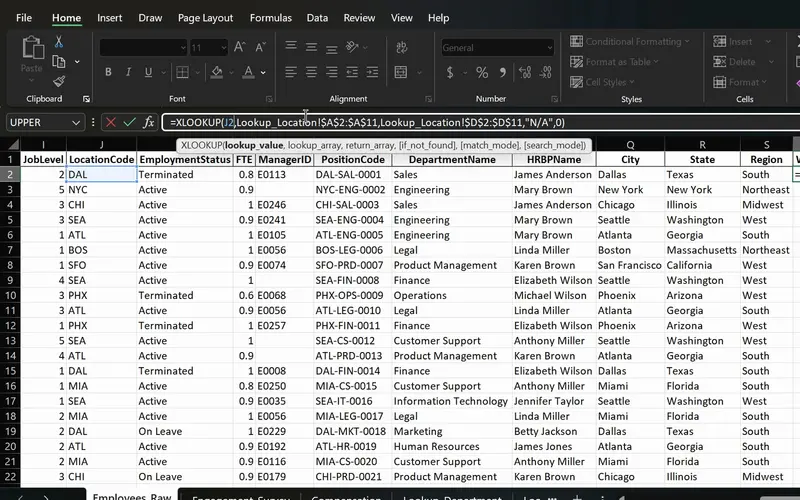
Project 06
PeopleInsight HR workbook
Employee data joined across sheets with one formula.
Payments matched to visits by participant ID with XLOOKUP, IFERROR for a visit with no payment yet, and FILTER for the visits due this week.
-
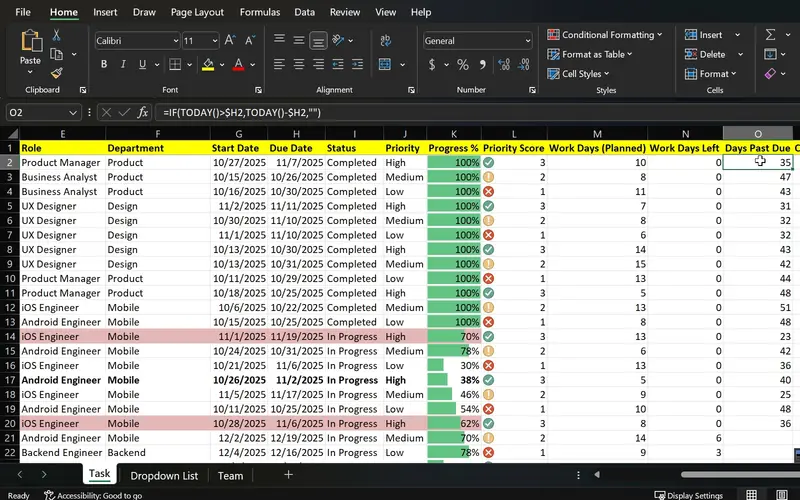
Project 07
TaskFlow
One sheet that shows what is done, what is late and what is urgent.
Built for tasks, it serves as a regulatory document and start-up tracker: each item with a status and an expiry or due date, lapsed ones coloured and a timeline up to site activation.
-
Project 02
Dunder Michael Paper Company employee database
Practice for a screening or deviation log: one Table keyed by ID, sorted by site and date, filtered by status, cleaned of stray spaces and duplicate rows.
-
Project 03
Sales Goal Tracker
Enrolment against target by site: COUNTIFS for screened, enrolled and withdrawn, IF with OR for a visit outside its window, and date functions for each target day.
Lessons
The lessons that matter, in course order.
The Complete Excel Course with AI Integration has 186 lessons. This page picks out 43 of them, 4 h 4 min of video. Each lesson keeps its number in the course.
Where to start
Lesson 19 Excel tables
Begin at Lesson 19 if you already enter data in Excel: site logs start as well-kept Tables, and Managing data in Excel, where this path opens, is free by email with its practice files. New to Excel? Begin at Lesson 1. If your logs are in order, go to Lesson 28 for visit windows and enrolment counts, or to Lesson 79 for documents, where the task tracker begins.
43 of 186 lessons · 4 h 4 min
03 Managing data in Excel: sort, filter and tables (Dunder Michael Paper employee database) Site logs as Excel Tables: a screening or deviation log keyed by participant ID, sorted by site and date, filtered by status, cleaned with TRIM and Find and Replace, duplicate rows removed, the header frozen and a tidy print for a monitoring visit. The lessons use an employee database.
- 19 Start here Excel tables Create and format a table, structured references and total row 8 min
- 20 Sorting data in Excel Single and multi-level sort on an employee database 6 min
- 21 Filtering data in Excel AutoFilter, text and number filters on employee data 10 min
- 22 Cleaning data in Excel TRIM, Paste Special values and Find and Replace 13 min
- 23 Remove duplicates in Excel Find and delete duplicate rows in an employee list 6 min
- 24 Flash Fill in Excel Split first and last names automatically 3 min
- 25 Text to Columns in Excel Split data by delimiter into separate columns 6 min
- 26 Freeze panes in Excel Lock header rows and columns while scrolling 3 min
- 27 Printing in Excel Print area, page orientation, scaling and page layout 6 min
04 Essential formulas and functions (IF, SUMIF and more) Counts and dates for a study: COUNTIF and COUNTIFS for screened, enrolled and withdrawn by site, IF with AND and OR for a visit outside its window, SUMIFS for payments by site, and date arithmetic for each visit's target day and window.
- 28 Logical functions in Excel TRUE and FALSE comparisons for beginners 5 min
- 29 The IF function in Excel Pass or fail results with a single condition 3 min
- 30 IF function practice in Excel Categorise sales data with IF formulas 6 min
- 31 Nested IF and IFS in Excel Customer value tiers with nested IF 6 min
- 32 Nested IF and IFS in Excel Sales performance labels with the IFS function 5 min
- 33 AND and OR with IF in Excel Flag high-value deals with multiple conditions 8 min
- 34 SUM, COUNT and COUNTA in Excel SUM with FILTER and counting numbers with COUNT 7 min
- 35 SUM, COUNT and COUNTA in Excel COUNTA, unique counts and completeness checks 4 min
- 36 SUMIF and COUNTIF in Excel Conditional sum and count with one criterion 8 min
- 37 SUMIFS and COUNTIFS in Excel Sum and count with multiple criteria 7 min
- 38 The Excel function library Insert Function dialog and Formula AutoComplete 5 min
- 39 Date and time functions in Excel TODAY, NOW, MONTH and date arithmetic 6 min
- 40 Excel Ninja Challenge COUNTIF, SUMIF, IF, COUNTIFS, SUMIFS and IFS practice 8 min
06 Data visualisation: charts and graphs Charts for the study meeting: a line chart of cumulative enrolment against target, a pie chart of screen-failure reasons and a combo chart of monthly enrolment against the running total.
- 50 Line charts in Excel Show trends over time with a line chart 4 min
- 51 Pie charts in Excel Show proportions and parts of a whole 4 min
- 52 Combo charts in Excel Column and line chart with a secondary axis 4 min
08 Advanced Excel functions: lookups, text and arrays XLOOKUP and INDEX and MATCH to match payments or visits by participant ID, IFERROR for a missing record, CONCAT for a key that joins ID and visit, TODAY and NETWORKDAYS for days to a visit or an expiry, then UNIQUE, FILTER and SORT for the visits due this week. The lessons use HR data.
- 69 XLOOKUP in Excel Exact match, if not found and two-way lookup 6 min
- 70 IFERROR in Excel Handle lookup errors in VLOOKUP and XLOOKUP formulas 3 min
- 71 INDEX and MATCH in Excel A flexible alternative to VLOOKUP 6 min
- 72 CONCAT and TEXTJOIN in Excel Combine employee names and text with a delimiter 3 min
- 73 LEFT, RIGHT and MID in Excel Extract parts of a text code like DAL-SAL-0001 7 min
- 74 TODAY, EOMONTH and NETWORKDAYS in Excel Date calculations for HR data 5 min
- 75 UNIQUE function in Excel Extract a distinct list with dynamic arrays 6 min
- 76 FILTER function in Excel Dynamic array filtering with AND and OR criteria 5 min
- 77 SORT and SORTBY in Excel Sort data dynamically with formulas 4 min
09 Project: task automation with data validation and forms TaskFlow as a regulatory document and start-up tracker: each document, approval or task with a status and priority from drop-downs, lapsed items highlighted, a Gantt-style timeline, the working days left and a protected sheet. The project tracks tasks; a document's expiry fits the same columns.
- 79 TaskFlow project tracker in Excel Overview of the task tracker dashboard 4 min
- 80 Designing a task tracker in Excel TaskFlow layout, columns and headers 5 min
- 81 Data validation in Excel Status and priority drop-down lists in TaskFlow 8 min
- 82 Conditional formatting in Excel Highlight overdue and completed tasks 8 min
- 83 Gantt chart in Excel Build a project timeline with conditional formatting 6 min
- 84 Data bars and icon sets in Excel Visual priority and progress in TaskFlow 6 min
- 85 NETWORKDAYS and TODAY in Excel Days remaining and task deadlines in TaskFlow 5 min
- 86 Protect a sheet and lock cells in Excel Secure the TaskFlow tracker workbook 4 min
- 87 Testing an Excel task tracker Stress test TaskFlow with sample data 3 min
Instructors
Who teaches it.

Instructor, Excel with AI
Virginia Thorn
Emmy Award winner. Teaches Excel with AI at Coding Liquids.
Questions
Asked before starting.
Which Excel course helps clinical research coordinators?
The Complete Excel Course with AI Integration from Coding Liquids, for the trackers a study site keeps: screening and deviation logs as Excel Tables, visit windows worked out with date arithmetic, enrolment by site with COUNTIFS and a chart against target, payments matched by participant ID with XLOOKUP, and the TaskFlow tracker for regulatory documents. None of its data comes from a trial. This page lists 43 lessons, 4 hours 4 minutes in all.
Can I schedule study visits from visit windows in Excel?
Yes, as date arithmetic, which The Complete Excel Course with AI Integration teaches: add each visit's day offset to the baseline date for the target, subtract and add the window for the earliest and latest dates, and use IF with OR to flag a visit done outside them. FILTER lists the visits falling due this week, and conditional formatting colours the overdue ones. The offsets and windows come from your protocol, not from the course.
Can I track enrolment against target by site?
Yes. With what The Complete Excel Course with AI Integration teaches, COUNTIFS counts screened, enrolled and withdrawn participants for each site and month, a division gives each site's progress towards its target, and a line chart sets cumulative enrolment against the target line, with a pie chart for screen-failure reasons. The lessons track sales against goals; enrolment against target has the same shape.
Can Excel check site payments against completed visits?
Yes, with lookups from The Complete Excel Course with AI Integration: build a key that joins participant ID and visit with CONCAT, let XLOOKUP bring each visit's payment from the payments sheet by that key, mark a completed visit with no payment yet through IFERROR, and total what each site has been paid against what it has earned with SUMIFS. No lesson reconciles study payments as such; the steps are taught on HR and sales data.
Does the course teach GCP or clinical trial systems?
No. The Complete Excel Course with AI Integration teaches Excel, not clinical research: Good Clinical Practice, protocol design, EDC and CTMS systems, safety reporting and the rules for handling participant data are not taught, and no lesson uses trial data. Which records may be kept in a spreadsheet is for the protocol, the sponsor and your institution to decide; the course covers the Excel for the logs and trackers they allow.
Excel with AI
See the whole course.
The Complete Excel Course with AI Integration: 16 hours of video in 186 lessons, built around 14 projects, with lifetime access, a Certificate of Completion and a 14-day money-back guarantee.
The same course
For another job, level or topic.
By job
Finance and accounting
- Accountants and finance teams
- Bookkeepers and accounts assistants
- FP&A and budget analysts
- Auditors and fraud examiners
- Payroll administrators
- Tax accountants and advisers
- Banking professionals
- Cost and management accountants
- Financial controllers
- Credit control and receivables teams
- Accounts payable teams
- Financial planners and advisers
- Credit analysts and loan officers
- Insurance underwriters
- Insurance claims handlers
- Reconciliation analysts
- Treasury analysts
- Medical billing and coding specialists
- Fund accountants
- Billing administrators
- AML and KYC analysts
- Actuarial analysts
- Insurance agents and brokers
HR and office administration
Operations and supply chain
- Operations and project managers
- Procurement and purchasing officers
- Logistics coordinators
- Inventory controllers and storekeepers
- Supply chain analysts
- Warehouse managers and supervisors
- PMO analysts
- Import and export coordinators
- Production planners
- Demand planners
- Fleet and transport managers
- Apparel merchandisers
Data and reporting
Sales, marketing and customer service
Business and management
Engineering, construction and manufacturing
- Quantity surveyors and estimators
- Civil and site engineers
- Quality managers and engineers
- Construction project managers
- Health and safety officers
- Document controllers
- Production managers and supervisors
- Mechanical and electrical engineers
- Industrial engineers
- Planning engineers
- Sustainability and ESG analysts
- Maintenance planners