



The Complete Excel Course with AI Integration
Excel course for government officers
For civil servants and public sector staff who compile registers, oversee budgets and report numbers in Excel. This overview outlines the portions of The Complete Excel Course with AI Integration relevant to those duties. It focuses on structured register tables, monthly and district totals, a budget against actual model, a tracker for correspondence deadlines, and Power Query for regional office returns.
Taught by Sagnik Bhattacharya and Virginia Thorn

What you will be able to do
At work, you will be able to:
- Maintain structured Excel Tables for cases, beneficiaries or applicants, filtered and sorted by status or district after removing duplicate rows and stray spaces.
- Calculate programme indicators broken down by month and district using PivotTables, SUMIFS and COUNTIFS.
- Compare departmental spending with budget allocations using a chart, slicers, KPI cards, variance figures and percentage variances.
- Monitor requests, correspondence and response deadlines by highlighting overdue actions, counting remaining working days and assigning drop-down statuses.
- Consolidate regional office return files from a single folder into one unified table using Power Query.
- Protect shared workbooks using sheet protection and locked cells, and establish defined print areas to produce tidy printouts of registers.
Projects
What you will build.
The course has 14 projects. These four matter most here.
-
Project 09
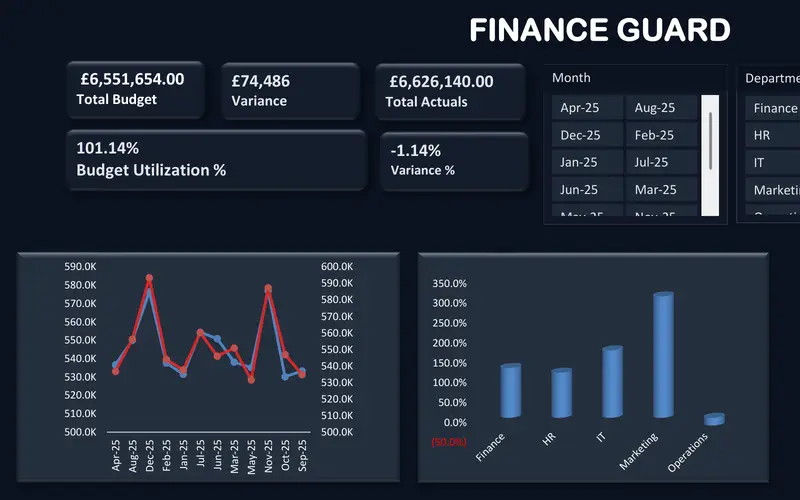
FinanceGuard
The budget vs actual report finance teams send every month.
A budget against actual model, which suits contrasting approved departmental allocations against expenditure to date, showing monetary and percentage variances for each line in a dashboard that managers can filter.
-
Project 07
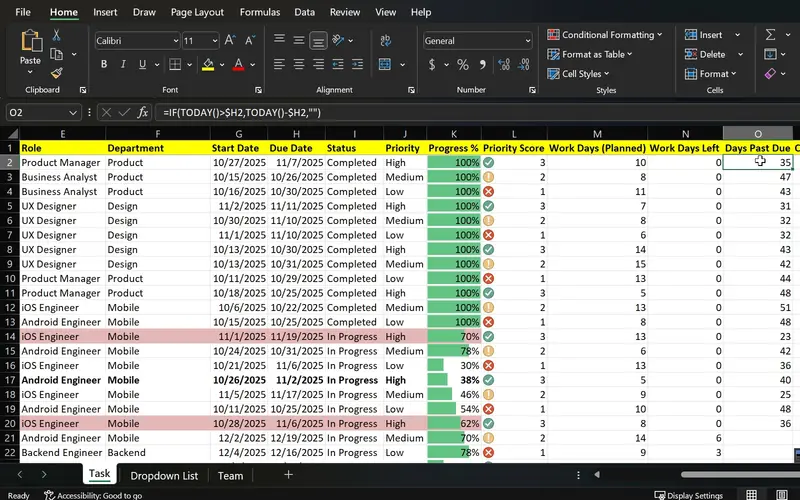
TaskFlow
One sheet that shows what is done, what is late and what is urgent.
Built for tasks, it also manages incoming requests and correspondence alongside response deadlines: it assigns a status to each entry, highlights overdue replies, tallies remaining working days, and locks the sheet before sharing.
-
Project 12
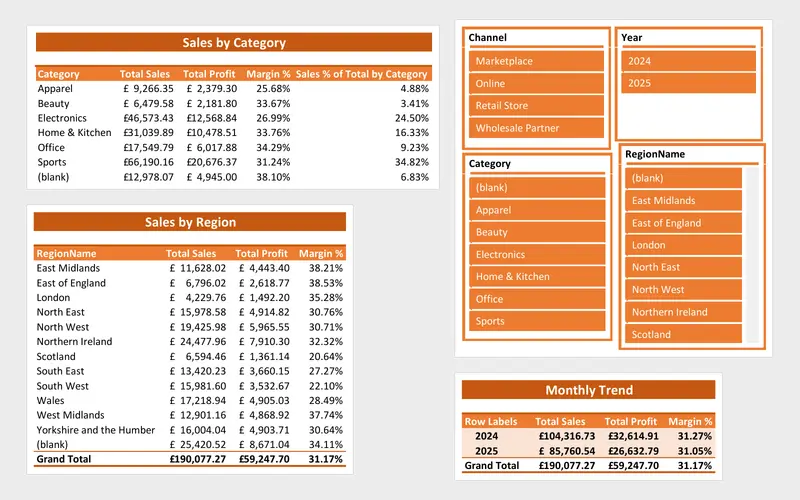
SalesFusion
A sales report that refreshes itself from a folder of files.
Built on sales files, its method also consolidates returns submitted by regional offices into a unified table: store each office file in a designated folder, then use Power Query to clean and append records whenever refreshed.
-
Project 02
Dunder Michael Paper Company employee database
A model for applicant, beneficiary or case registers, kept in the structured manner of this staff roster: arranged as an Excel table, sorted, filtered, stripped of duplicate rows, and divided into separate name columns.
Lessons
The lessons that matter, in course order.
The Complete Excel Course with AI Integration has 186 lessons. This page picks out 56 of them, 4 h 57 min of video. Each lesson keeps its number in the course.
Where to start
Lesson 19 Excel tables
Start at Lesson 19 if you are already used to entering data in Excel, as maintaining registers is the priority. That section, Managing data in Excel, is available free by email together with its practice files by requesting it on the course page. If you are entirely new to Excel, begin at Lesson 1. If you already keep clean tables for your registers, proceed directly to Lesson 79 for the tracking tool or Lesson 115 to focus on budgets.
56 of 186 lessons · 4 h 57 min
03 Managing data in Excel: sort, filter and tables (Dunder Michael Paper employee database) Keep administrative registers orderly using Excel Tables, sorting, filtering, text tidying with TRIM and Find and Replace, duplicate row deletion, name splitting via Flash Fill and Text to Columns, frozen headers, and printing setup, taught using an employee database.
- 19 Start here Excel tables Create and format a table, structured references and total row 8 min
- 20 Sorting data in Excel Single and multi-level sort on an employee database 6 min
- 21 Filtering data in Excel AutoFilter, text and number filters on employee data 10 min
- 22 Cleaning data in Excel TRIM, Paste Special values and Find and Replace 13 min
- 23 Remove duplicates in Excel Find and delete duplicate rows in an employee list 6 min
- 24 Flash Fill in Excel Split first and last names automatically 3 min
- 25 Text to Columns in Excel Split data by delimiter into separate columns 6 min
- 26 Freeze panes in Excel Lock header rows and columns while scrolling 3 min
- 27 Printing in Excel Print area, page orientation, scaling and page layout 6 min
04 Essential formulas and functions (IF, SUMIF and more) Use SUMIF, SUMIFS, COUNTIF and COUNTIFS to total and count register rows based on single or multiple criteria, broken down by category, district or month.
- 36 SUMIF and COUNTIF in Excel Conditional sum and count with one criterion 8 min
- 37 SUMIFS and COUNTIFS in Excel Sum and count with multiple criteria 7 min
07 PivotTables and PivotCharts: data analysis made easy Examine programme indicators across districts and months using PivotTables, slicers and PivotCharts, grouped by date and refreshed as incoming returns arrive. The lessons are based on sales orders.
- 57 PivotTables 101 in Excel What a PivotTable does and the sales dataset 5 min
- 58 Preparing data for PivotTables Clean data with TRIM, PROPER, find and replace 5 min
- 59 Create your first PivotTable in Excel Insert a PivotTable from a sales table 1 min
- 60 PivotTable fields in Excel Rows, values, columns and Value Field Settings 2 min
- 61 PivotTable summaries in Excel Sales by product category and grouping by date 4 min
- 62 Slicers in Excel Filter PivotTables with clickable buttons 3 min
- 63 PivotCharts in Excel Create interactive charts from a PivotTable 5 min
- 64 PivotTable design Tab Report layouts, PivotTable styles and number formats 5 min
- 65 Refresh a PivotTable in Excel Update pivots when source data changes 2 min
- 66 Excel Ninja Challenge PivotTable sales by region, category and monthly trend 1 min
09 Project: task automation with data validation and forms Deploy TaskFlow as an intake log for requests and correspondence: priority and status drop-down choices, visual flags for overdue items, a Gantt-style timeline, remaining working days calculated with TODAY and NETWORKDAYS, and sheet protection before distributing the file.
- 79 TaskFlow project tracker in Excel Overview of the task tracker dashboard 4 min
- 80 Designing a task tracker in Excel TaskFlow layout, columns and headers 5 min
- 81 Data validation in Excel Status and priority drop-down lists in TaskFlow 8 min
- 82 Conditional formatting in Excel Highlight overdue and completed tasks 8 min
- 83 Gantt chart in Excel Build a project timeline with conditional formatting 6 min
- 84 Data bars and icon sets in Excel Visual priority and progress in TaskFlow 6 min
- 85 NETWORKDAYS and TODAY in Excel Days remaining and task deadlines in TaskFlow 5 min
- 86 Protect a sheet and lock cells in Excel Secure the TaskFlow tracker workbook 4 min
- 87 Testing an Excel task tracker Stress test TaskFlow with sample data 3 min
12 Project: FinanceGuard budget variance analyser (budget vs actual Excel dashboard) FinanceGuard sets up separate tables for budgets and actuals, assembling a model with SUMIFS and dynamic arrays, displaying monetary variance and percentage variance via coloured number formats, alongside PivotTables, KPI cards, slicers and a combo chart. A department's allocation and expenditure follow this same layout.
- 115 FinanceGuard budget vs actual dashboard Excel project overview 3 min
- 116 Excel tables for budget and actual data Organise the FinanceGuard datasets 4 min
- 117 Budget vs actual model in Excel SORT, UNIQUE, VSTACK, LET, TEXTSPLIT, SUMIFS 8 min
- 118 Budget variance in Excel Calculate variance and percent variance 4 min
- 119 Custom number formats in Excel Show budget variances with colours and signs 2 min
- 120 PivotTables for budget vs actual The FinanceGuard pivot workspace 8 min
- 121 KPI cards in Excel Summary cards for a budget variance dashboard 4 min
- 122 Budget vs actual charts in Excel Combo chart with secondary axis for variance 5 min
- 123 Slicers and PivotCharts in Excel Interactive FinanceGuard budget dashboard 4 min
- 124 Finish the FinanceGuard dashboard in Excel Final polish and variance insights 10 min
15 SalesFusion: advanced data tools and a Power Query modelling system Use Power Query to process returns submitted from multiple offices: import CSV data, clean up text and columns, correct data types, generate month fields, merge lookup tables, append tables, and combine the files in a folder into one table. The lessons rely on sales files.
- 153 SalesFusion Power Query project Excel ETL pipeline and data model overview 5 min
- 154 Introduction to Power Query in Excel The ETL workflow explained 5 min
- 155 Import a CSV with Power Query Get data from text and transform data 2 min
- 156 Clean columns in Power Query Remove and rename columns for modelling 5 min
- 157 Clean text in Power Query Trim, clean, replace values and fix text case 6 min
- 158 Data types in Power Query Fix date, whole number, decimal and text types 7 min
- 159 Date columns in Power Query Add year, month and year-month fields for reports 7 min
- 160 Business logic in Power Query Custom and conditional columns for profitability 6 min
- 161 Group By in Power Query Summarise sales by month and region to validate data 5 min
- 162 Close and Load in Power Query Connection only, table or Data Model 5 min
- 163 Merge queries in Power Query Look up product and region names with a left join 5 min
- 164 Reuse a Power Query pipeline Duplicate queries for a new year of sales data 5 min
- 165 Append queries in Power Query Combine 2024 and 2025 sales tables 3 min
- 166 From Folder in Power Query Combine every sales file in a folder automatically 9 min
- 167 From Folder automation in Power Query Profit metrics and fiscal year columns 7 min
- 168 Build a sales fact table in Power Query Merge lookups and append history 6 min
Instructors
Who teaches it.

Instructor, Excel with AI
Virginia Thorn
Emmy Award winner. Teaches Excel with AI at Coding Liquids.
Questions
Asked before starting.
Is an Excel course available for government officers?
Yes. The Complete Excel Course with AI Integration from Coding Liquids teaches the spreadsheet tools required for public sector desk work: keeping registers organised as clean tables, reporting monthly and district indicators using PivotTables, tracking spending against allocations in FinanceGuard, monitoring correspondence deadlines and requests, and applying Power Query to regional returns. The selected 56 lessons on this page take 4 hours 57 minutes of the course's 16 hours.
Does this Excel course for government officers cover public finance or procurement regulations?
No. The Complete Excel Course with AI Integration focuses on practical Excel skills rather than public administration: it does not cover government IT systems, public financial management regulations or procurement rules. The material assumes you are familiar with your own department's guidelines, providing assistance with the spreadsheets built around them: registers, trackers, indicator tables and budget monitoring models.
Can government officers use Power Query to combine returns sent by regional offices?
Yes, as long as each office provides its file using the same layout. In The Complete Excel Course with AI Integration, Power Query imports CSV files, cleans columns, sets appropriate data types, appends tables, and consolidates the files in a folder into a single table that updates on refresh. Although the lessons demonstrate this with sales data, returns submitted by district offices follow the same steps.
How can a government officer protect a workbook before circulating it?
The Complete Excel Course with AI Integration demonstrates sheet protection within the TaskFlow project: locking cells and enabling sheet protection keeps formulas from being overwritten, whilst drop-down lists restrict entries to a fixed set of choices. This training addresses protection against accidental edits, not official information security rules for government data.
Excel with AI
See the whole course.
The Complete Excel Course with AI Integration: 16 hours of video in 186 lessons, built around 14 projects, with lifetime access, a Certificate of Completion and a 14-day money-back guarantee.
The same course
For another job, level or topic.
By job
Finance and accounting
- Accountants and finance teams
- Bookkeepers and accounts assistants
- FP&A and budget analysts
- Auditors and fraud examiners
- Payroll administrators
- Tax accountants and advisers
- Banking professionals
- Cost and management accountants
- Financial controllers
- Credit control and receivables teams
- Accounts payable teams
- Financial planners and advisers
- Credit analysts and loan officers
- Insurance underwriters
- Insurance claims handlers
- Reconciliation analysts
- Treasury analysts
- Medical billing and coding specialists
- Fund accountants
- Billing administrators
- AML and KYC analysts
- Actuarial analysts
- Insurance agents and brokers
HR and office administration
Operations and supply chain
- Operations and project managers
- Procurement and purchasing officers
- Logistics coordinators
- Inventory controllers and storekeepers
- Supply chain analysts
- Warehouse managers and supervisors
- PMO analysts
- Import and export coordinators
- Production planners
- Demand planners
- Fleet and transport managers
- Apparel merchandisers
Data and reporting
Sales, marketing and customer service
Business and management
Engineering, construction and manufacturing
- Quantity surveyors and estimators
- Civil and site engineers
- Quality managers and engineers
- Construction project managers
- Health and safety officers
- Document controllers
- Production managers and supervisors
- Mechanical and electrical engineers
- Industrial engineers
- Planning engineers
- Sustainability and ESG analysts
- Maintenance planners