



The Complete Excel Course with AI Integration
Excel course for school and college administrators
For school and college administrators who keep student records, fees, enrolment and staff leave in Excel. This page picks out the parts of The Complete Excel Course with AI Integration that school office work uses: clean student lists with consistent class codes, fees collected and dues outstanding, enrolment and attendance reports, lookups from fee schedules, working days for leave, and charts for the head or the board.
Taught by Sagnik Bhattacharya and Virginia Thorn

What you will be able to do
At work, you will be able to:
- Keep student records in an Excel Table with class and section codes from drop-down lists, sorted, filtered and cleaned of duplicate entries.
- Total fees collected by class and month with SUMIFS, and list every account with dues outstanding with FILTER and SORT.
- Report enrolment and attendance by class, year or month with PivotTables and slicers.
- Bring each student's fee from a fee schedule with XLOOKUP, and split admission numbers into their parts with LEFT, RIGHT and MID.
- Count staff leave in working days with NETWORKDAYS, and total it by person with SUMIFS.
- Prepare clear charts for the head or the board: enrolment over the years, fees collected against fees due, and the share by class.
Projects
What you will build.
The course has 14 projects. These five matter most here.
-
Project 06
PeopleInsight HR workbook
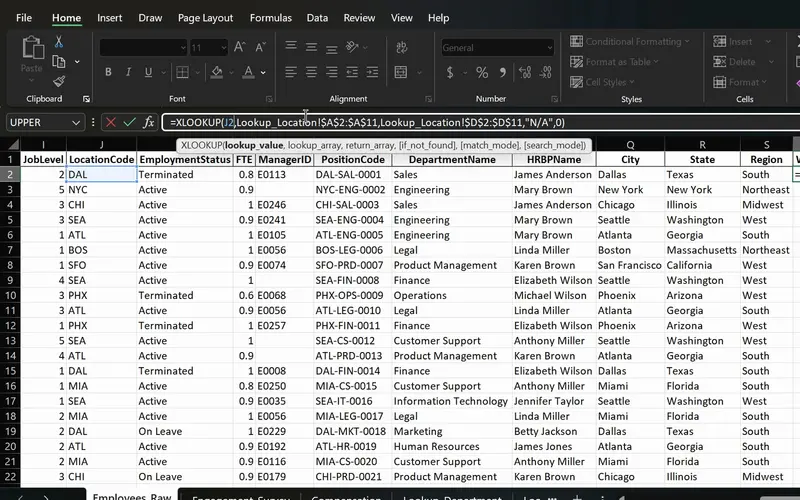
Employee data joined across sheets with one formula.
Staff and student records joined across sheets, practised on HR data: a fee looked up by class, leave counted in working days with NETWORKDAYS, and codes split with LEFT and MID.
-
Project 05
SalesPlusPerformance
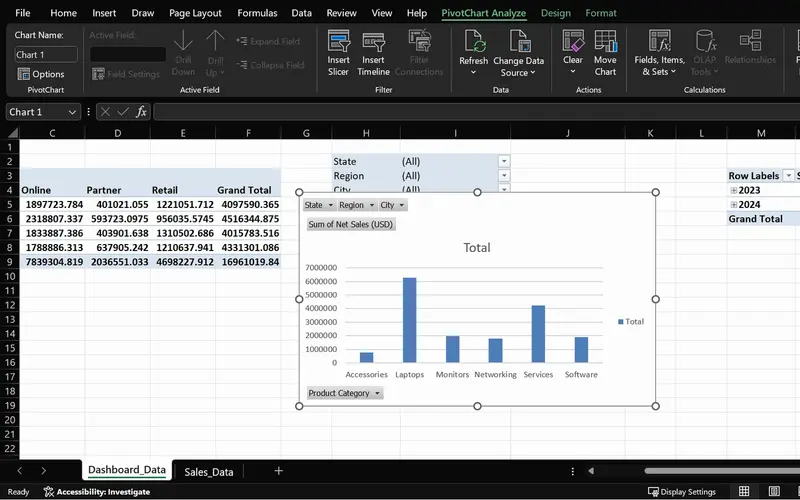
A sales question answered in seconds, straight from the order data.
Enrolment counts by class and year, and fees collected by month, laid out as the lessons lay out sales orders, ready for the head's monthly report.
-
Project 04
Marketing Engagement Dashboard
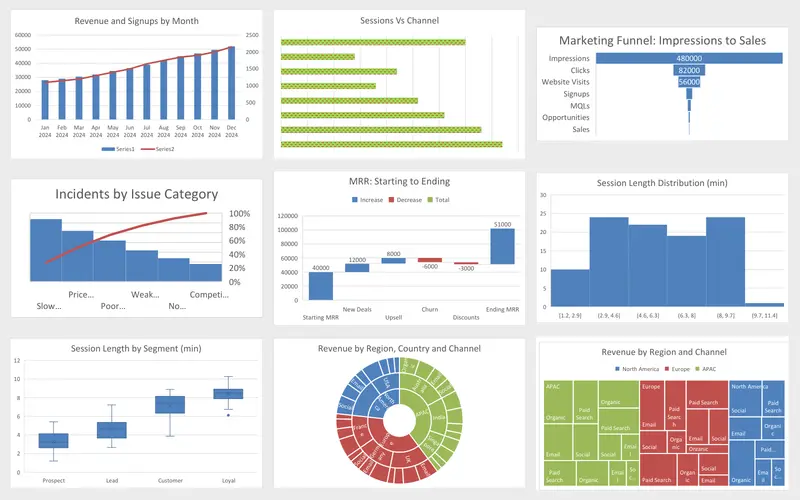
Nine charts, each picked for the question it answers.
Charts for a board or governors' report, practised on marketing data: enrolment as a line over the years and fees collected against fees due as a combo.
-
Project 02
Dunder Michael Paper Company employee database
Student records kept the way the lessons keep employee records: one table, sorted by class, filtered by year, cleaned of duplicates and printed as class lists.
-
Project 03
Sales Goal Tracker
SUMIFS, COUNTIFS and IF on sales targets; in a school office the same functions total fees collected by class and month and mark each account paid or due.
Lessons
The lessons that matter, in course order.
The Complete Excel Course with AI Integration has 186 lessons. This page picks out 57 of them, 4 h 48 min of video. Each lesson keeps its number in the course.
Where to start
Lesson 19 Excel tables
Begin at Lesson 19 if you already keep records in Excel: a clean student list comes first. That section, Managing data in Excel, is free by email with its practice files: ask for it on the course page. New to Excel? Begin at Lesson 1. If tables and SUMIFS are routine, go to Lesson 57 for enrolment and fee reports or to Lesson 67 for lookups and leave.
57 of 186 lessons · 4 h 48 min
03 Managing data in Excel: sort, filter and tables (Dunder Michael Paper employee database) Student records under control: Excel Tables, sorting by class or surname, filtering by year, cleaning an export with TRIM and Find and Replace, removing duplicate entries, splitting names, freezing headers and printing class lists. The lessons use an employee database.
- 19 Start here Excel tables Create and format a table, structured references and total row 8 min
- 20 Sorting data in Excel Single and multi-level sort on an employee database 6 min
- 21 Filtering data in Excel AutoFilter, text and number filters on employee data 10 min
- 22 Cleaning data in Excel TRIM, Paste Special values and Find and Replace 13 min
- 23 Remove duplicates in Excel Find and delete duplicate rows in an employee list 6 min
- 24 Flash Fill in Excel Split first and last names automatically 3 min
- 25 Text to Columns in Excel Split data by delimiter into separate columns 6 min
- 26 Freeze panes in Excel Lock header rows and columns while scrolling 3 min
- 27 Printing in Excel Print area, page orientation, scaling and page layout 6 min
04 Essential formulas and functions (IF, SUMIF and more) Fees and counts as formulas: IF to mark an account paid or due, IFS for bands, AND and OR for two conditions, COUNTIF and COUNTIFS for enrolment by class, SUMIF and SUMIFS for fees by class and month, and TODAY with date arithmetic for days overdue.
- 28 Logical functions in Excel TRUE and FALSE comparisons for beginners 5 min
- 29 The IF function in Excel Pass or fail results with a single condition 3 min
- 30 IF function practice in Excel Categorise sales data with IF formulas 6 min
- 31 Nested IF and IFS in Excel Customer value tiers with nested IF 6 min
- 32 Nested IF and IFS in Excel Sales performance labels with the IFS function 5 min
- 33 AND and OR with IF in Excel Flag high-value deals with multiple conditions 8 min
- 34 SUM, COUNT and COUNTA in Excel SUM with FILTER and counting numbers with COUNT 7 min
- 35 SUM, COUNT and COUNTA in Excel COUNTA, unique counts and completeness checks 4 min
- 36 SUMIF and COUNTIF in Excel Conditional sum and count with one criterion 8 min
- 37 SUMIFS and COUNTIFS in Excel Sum and count with multiple criteria 7 min
- 38 The Excel function library Insert Function dialog and Formula AutoComplete 5 min
- 39 Date and time functions in Excel TODAY, NOW, MONTH and date arithmetic 6 min
- 40 Excel Ninja Challenge COUNTIF, SUMIF, IF, COUNTIFS, SUMIFS and IFS practice 8 min
05 Text functions and data validation (enhancing data quality) Consistent records: CONCAT and TEXTJOIN for full names, TRIM and PROPER for spacing and capitals, FIND and SUBSTITUTE for stray characters, Text to Columns, and drop-down lists for class, section and status, with a Ninja Challenge on a messy list.
- 41 CONCAT, the & operator and TEXTJOIN in Excel Combine text from multiple cells 6 min
- 42 TRIM, UPPER, LOWER and PROPER in Excel Clean messy text and fix capitalisation 6 min
- 43 FIND, SEARCH and SUBSTITUTE in Excel Locate and replace text with formulas 5 min
- 44 Text to Columns wizard in Excel Split a column by a comma delimiter 4 min
- 45 Data validation in Excel Create drop-down lists for consistent data entry 4 min
- 46 Ninja Challenge: problem Clean messy data with text functions and validation 4 min
- 47 Ninja Challenge: solution PROPER, Text to Columns and drop-down lists 7 min
06 Data visualisation: charts and graphs Charts for reports to the head or the board: choosing the chart, column charts by class, a line for enrolment over the years, pie charts for shares, combo charts for fees collected against fees due, and formatting. The lessons chart marketing data.
- 48 Choosing the right Excel chart Column, line, pie, combo and modern chart types 4 min
- 49 Column charts in Excel Insert, format and label a column chart 5 min
- 50 Line charts in Excel Show trends over time with a line chart 4 min
- 51 Pie charts in Excel Show proportions and parts of a whole 4 min
- 52 Combo charts in Excel Column and line chart with a secondary axis 4 min
- 53 Formatting charts in Excel Titles, data labels, colours and chart styles 7 min
07 PivotTables and PivotCharts: data analysis made easy PivotTables, slicers and PivotCharts for enrolment, attendance and fees by class, year or month, refreshed when the records change. The lessons use sales orders.
- 57 PivotTables 101 in Excel What a PivotTable does and the sales dataset 5 min
- 58 Preparing data for PivotTables Clean data with TRIM, PROPER, find and replace 5 min
- 59 Create your first PivotTable in Excel Insert a PivotTable from a sales table 1 min
- 60 PivotTable fields in Excel Rows, values, columns and Value Field Settings 2 min
- 61 PivotTable summaries in Excel Sales by product category and grouping by date 4 min
- 62 Slicers in Excel Filter PivotTables with clickable buttons 3 min
- 63 PivotCharts in Excel Create interactive charts from a PivotTable 5 min
- 64 PivotTable design Tab Report layouts, PivotTable styles and number formats 5 min
- 65 Refresh a PivotTable in Excel Update pivots when source data changes 2 min
- 66 Excel Ninja Challenge PivotTable sales by region, category and monthly trend 1 min
08 Advanced Excel functions: lookups, text and arrays XLOOKUP, VLOOKUP and INDEX and MATCH for fees and details from another sheet, IFERROR for a missing record, LEFT, RIGHT and MID for parts of admission numbers, NETWORKDAYS for staff leave in working days, EOMONTH for month ends, and UNIQUE, FILTER and SORT for lists such as dues outstanding. The lessons use an HR dataset.
- 67 Lookup functions in Excel The PeopleInsight HR dataset and why lookups matter 2 min
- 68 VLOOKUP in Excel Find employee data across sheets with exact match 4 min
- 69 XLOOKUP in Excel Exact match, if not found and two-way lookup 6 min
- 70 IFERROR in Excel Handle lookup errors in VLOOKUP and XLOOKUP formulas 3 min
- 71 INDEX and MATCH in Excel A flexible alternative to VLOOKUP 6 min
- 72 CONCAT and TEXTJOIN in Excel Combine employee names and text with a delimiter 3 min
- 73 LEFT, RIGHT and MID in Excel Extract parts of a text code like DAL-SAL-0001 7 min
- 74 TODAY, EOMONTH and NETWORKDAYS in Excel Date calculations for HR data 5 min
- 75 UNIQUE function in Excel Extract a distinct list with dynamic arrays 6 min
- 76 FILTER function in Excel Dynamic array filtering with AND and OR criteria 5 min
- 77 SORT and SORTBY in Excel Sort data dynamically with formulas 4 min
- 78 Excel Ninja Challenge XLOOKUP, totals and text concatenation lookup challenge 3 min
Instructors
Who teaches it.

Instructor, Excel with AI
Virginia Thorn
Emmy Award winner. Teaches Excel with AI at Coding Liquids.
Questions
Asked before starting.
Which Excel course suits school and college administrators?
The Complete Excel Course with AI Integration from Coding Liquids suits the spreadsheet work of a school or college office: student records in clean tables with consistent class codes, fees collected and dues outstanding with SUMIFS and FILTER, enrolment and attendance reports in PivotTables, staff leave in working days with NETWORKDAYS, and charts for the head or the board. This page lists 57 lessons, 4 hours 48 minutes of the course's 16 hours.
Does it cover school management software or education rules?
No. Management information systems, statutory returns and education regulation are outside The Complete Excel Course with AI Integration, which is about Excel itself. Where it helps is after an export: tidying the records, checking codes, totalling fees and building the reports a head or board asks for, all with lessons listed on this page.
Can I track fees and dues in Excel?
Yes, with functions The Complete Excel Course with AI Integration teaches. XLOOKUP brings each student's fee from a schedule by class, SUMIFS adds what has been paid, the difference is what is due, IF marks the account paid or due, and FILTER with SORT lists every account still owing, largest first. The lessons use HR and sales data, not fees.
Can Excel build the school timetable?
Not as a lesson: The Complete Excel Course with AI Integration has no timetabling project. What it gives is the checking around one: drop-down lists keep subjects and rooms to set names, COUNTIFS counts how often a teacher or room appears in the same period so a clash shows up, and frozen panes keep the days and periods in view on a large grid.
Can I work out staff leave in working days?
Yes. NETWORKDAYS in The Complete Excel Course with AI Integration counts the working days between two dates, leaving out weekends, so each leave request becomes a number of days; SUMIFS then totals the days by person and type of leave, and a PivotTable shows them by month. The lessons count working days on HR data.
Excel with AI
See the whole course.
The Complete Excel Course with AI Integration: 16 hours of video in 186 lessons, built around 14 projects, with lifetime access, a Certificate of Completion and a 14-day money-back guarantee.
The same course
For another job, level or topic.
By job
Finance and accounting
- Accountants and finance teams
- Bookkeepers and accounts assistants
- FP&A and budget analysts
- Auditors and fraud examiners
- Payroll administrators
- Tax accountants and advisers
- Banking professionals
- Cost and management accountants
- Financial controllers
- Credit control and receivables teams
- Accounts payable teams
- Financial planners and advisers
- Credit analysts and loan officers
- Insurance underwriters
- Insurance claims handlers
- Reconciliation analysts
- Treasury analysts
- Medical billing and coding specialists
- Fund accountants
- Billing administrators
- AML and KYC analysts
- Actuarial analysts
- Insurance agents and brokers
HR and office administration
Operations and supply chain
- Operations and project managers
- Procurement and purchasing officers
- Logistics coordinators
- Inventory controllers and storekeepers
- Supply chain analysts
- Warehouse managers and supervisors
- PMO analysts
- Import and export coordinators
- Production planners
- Demand planners
- Fleet and transport managers
- Apparel merchandisers
Data and reporting
Sales, marketing and customer service
Business and management
Engineering, construction and manufacturing
- Quantity surveyors and estimators
- Civil and site engineers
- Quality managers and engineers
- Construction project managers
- Health and safety officers
- Document controllers
- Production managers and supervisors
- Mechanical and electrical engineers
- Industrial engineers
- Planning engineers
- Sustainability and ESG analysts
- Maintenance planners