The Complete Excel Course with AI Integration

Build the Excel workbooks companies actually run on, with AI.

Dashboards, Power Query and DAX, macros and VBA, and AI with Copilot, ChatGPT and Claude.

30,000+ students in 175 countries

14-day money-back guarantee · Lifetime access · Certificate of Completion

  • Beginner to advanced
  • 16 hours
  • 186 lessons
  • English, with captions

What you will learn

By the end, you will be able to:

  • Open a messy export and make it clean, deduplicated and consistent in minutes with TRIM, Remove Duplicates, Text to Columns, Flash Fill and Data Validation.
  • Answer "how did the West region do last quarter?" in seconds with PivotTables, slicers and PivotCharts.
  • Join data from separate sheets with VLOOKUP, XLOOKUP and INDEX MATCH, and build lists that update themselves with UNIQUE, FILTER and SORT.
  • Turn a year of campaign data into a marketing dashboard with CTR, Conversion Rate and ROI.
  • Build the budget vs actual dashboard finance teams ask for: a variance engine, KPI cards, charts and slicers.
  • Load, clean and combine a whole folder of sales files with Power Query (ETL: Extract, Transform, Load), model them in Power Pivot and write DAX measures, the same skills Power BI uses.
  • Record and write macros and VBA that validate a sheet in one click, and build Power Automate Desktop flows that run your weekly report for you.
  • Use Copilot, ChatGPT and Claude inside Excel for formulas, PivotTables, charts, cleaning and analysis, with a QA checklist so a wrong answer never slips through.
  • Model a SIP, an SWP and a full retirement plan with inflation built in.

Projects

What you will build.

You build 14 projects in the course. Here is what eleven of them look like.
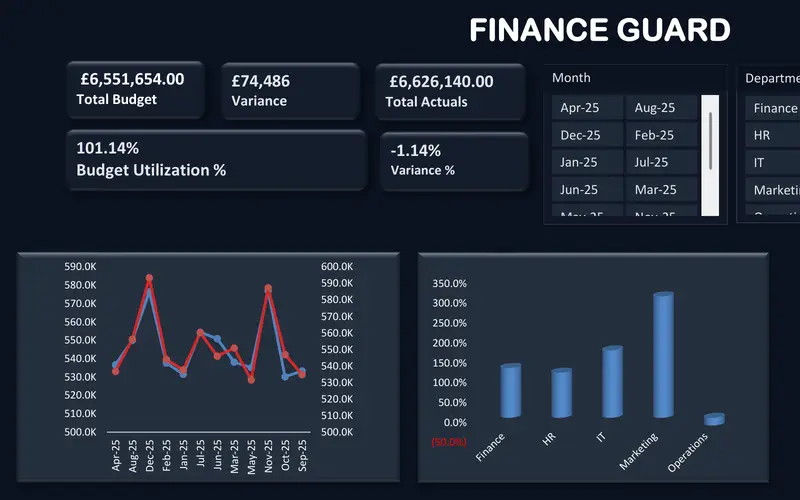
  • Budget vs actual dashboard in Excel (FinanceGuard): total budget, actuals and variance cards above a monthly line chart and a column chart by department.

    Project 09

    FinanceGuard

    The budget vs actual report finance teams send every month.

    Budget vs actual with SORT, UNIQUE, VSTACK, LET, TEXTSPLIT and SUMIFS, a variance engine and custom number formats.
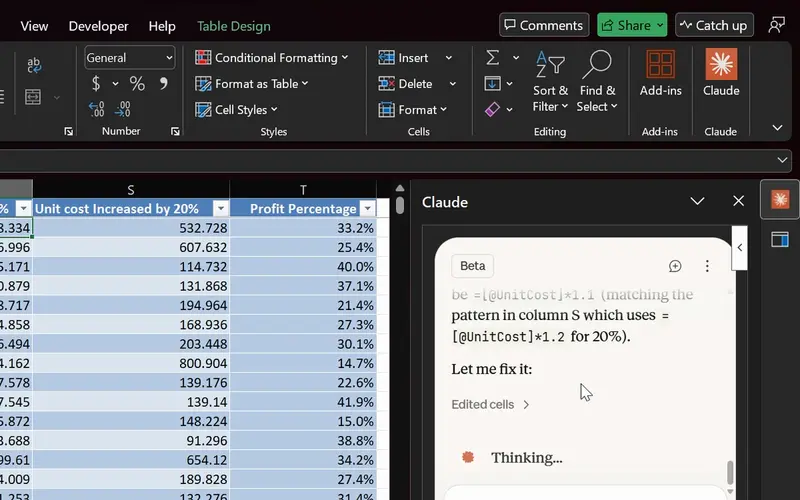
  • Claude AI in Excel fixing a formula: the Claude panel explains the mistake in a unit cost column and edits the cells, beside the profit percentage column.

    Project 14

    Agentic AI in Excel

    AI finds and fixes the formula; you check it before it counts.

    Copilot, ChatGPT and Claude on real tasks, plus the COPILOT function, Copilot Guided Help, Microsoft Stride and Claude in Excel.
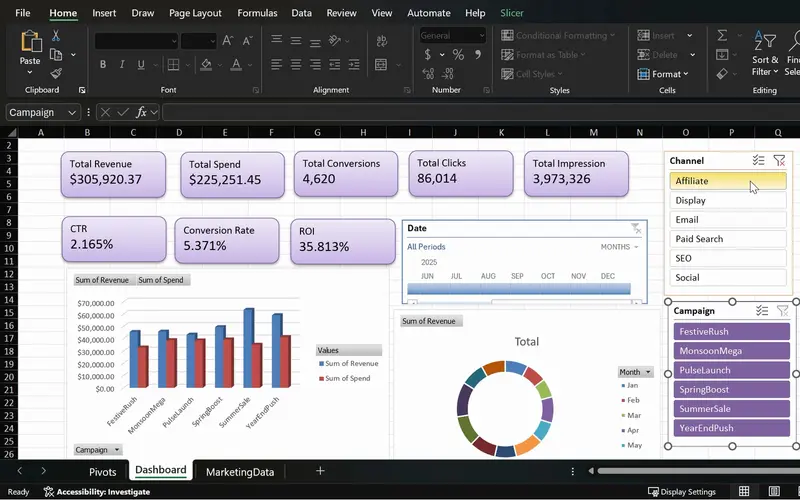
  • Marketing dashboard in Excel with slicers at work (MarketPulse): KPI cards, a spend against revenue chart and a monthly ring, filtered to one channel by the Channel and Campaign slicers.

    Project 08

    MarketPulse

    One screen that shows which campaigns earn back their spend.

    A marketing dashboard with six PivotTables, KPI cards, charts, a timeline and slicers.
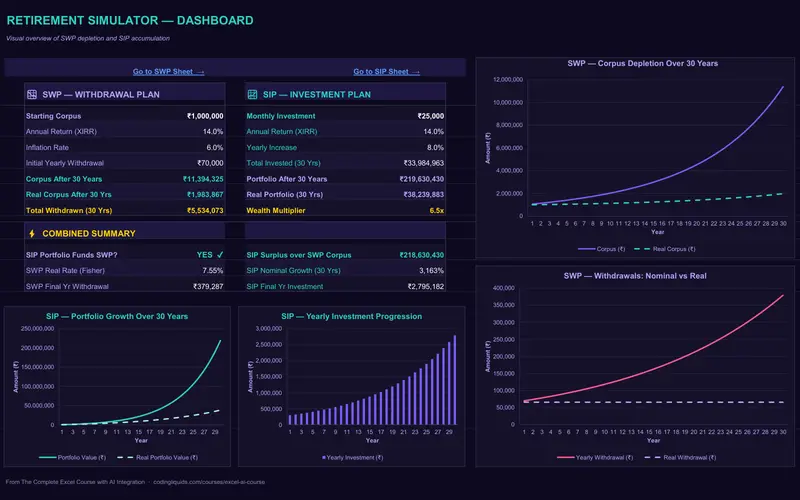
  • SIP and SWP retirement simulator in Excel (WealthFlow): withdrawal and investment plans beside four charts of corpus, withdrawals and portfolio growth over 30 years.

    Project 10

    WealthFlow

    A retirement plan that shows how long the money lasts.

    SIP and SWP calculators and a lifetime retirement simulator.
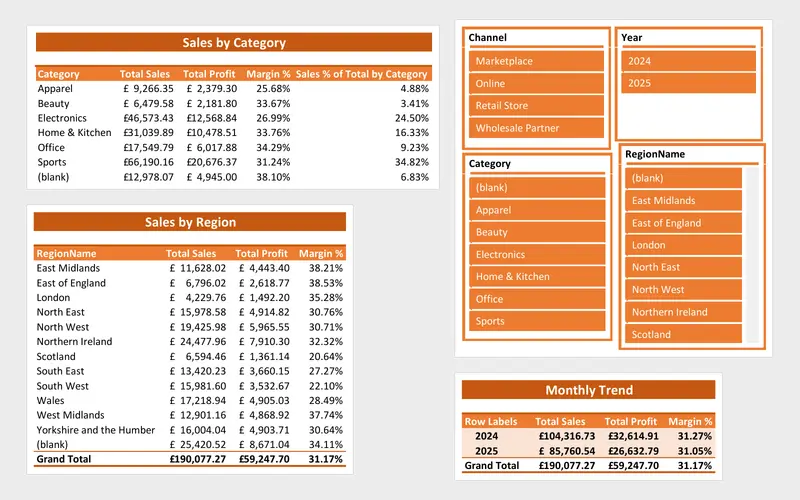
  • Power Query sales report in Excel (SalesFusion): sales by category, sales by region and a monthly trend, with slicers for channel, year, category and region.

    Project 12

    SalesFusion

    A sales report that refreshes itself from a folder of files.

    Power Query ETL, a Power Pivot data model, DAX measures and a report built from the data model.
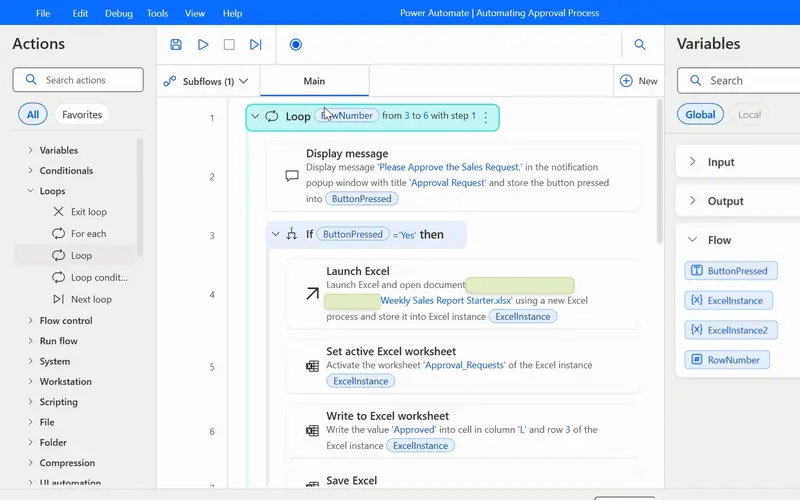
  • Power Automate Desktop flow for Excel (AutoFlow): a loop that asks for approval, opens the workbook and writes the answer into the sheet.

    Project 13

    AutoFlow

    The weekly report routine, run by a flow instead of by you.

    Power Automate Desktop flows that read, write and check Excel for you.
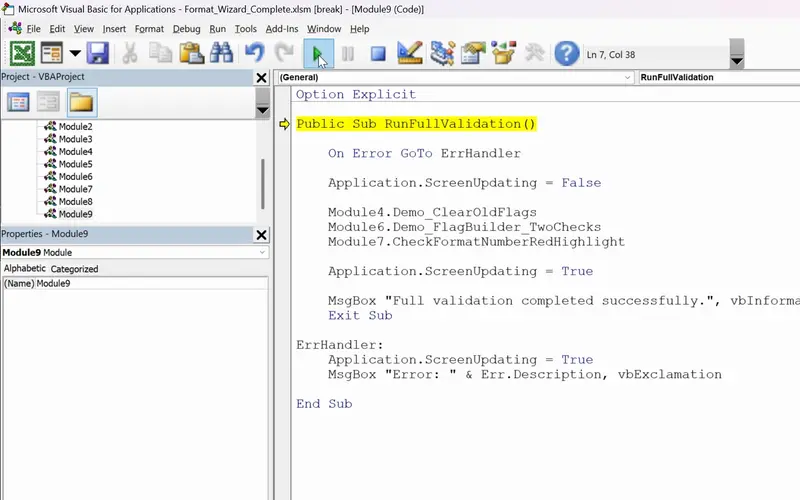
  • Excel VBA macro editor (FormatWizard): a macro that runs every validation check on a sheet and reports when it has finished.

    Project 11

    FormatWizard

    One click that checks a whole sheet for you.

    Recorded macros, then VBA with loops, validation rules and Debug.Print.
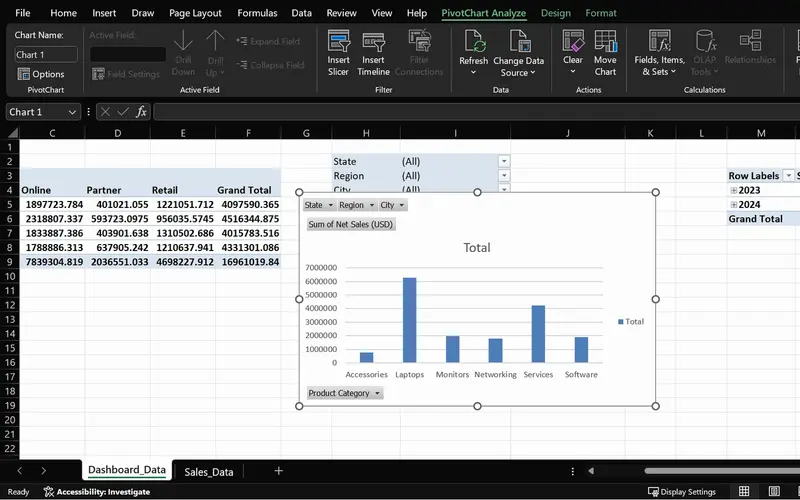
  • Excel PivotTables and a PivotChart of sales data (SalesPlusPerformance): net sales by product category as a column chart, with State, Region and City filters.

    Project 05

    SalesPlusPerformance

    A sales question answered in seconds, straight from the order data.

    PivotTables, PivotCharts, slicers and Refresh All on order-level sales data.
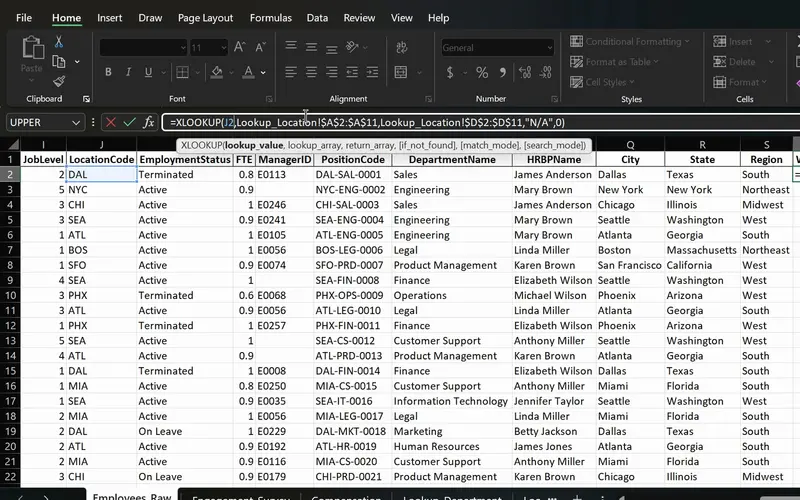
  • XLOOKUP formula in Excel (PeopleInsight): each employee row looks up its location from another sheet.

    Project 06

    PeopleInsight HR workbook

    Employee data joined across sheets with one formula.

    VLOOKUP, XLOOKUP, INDEX MATCH, text and date functions, dynamic arrays.
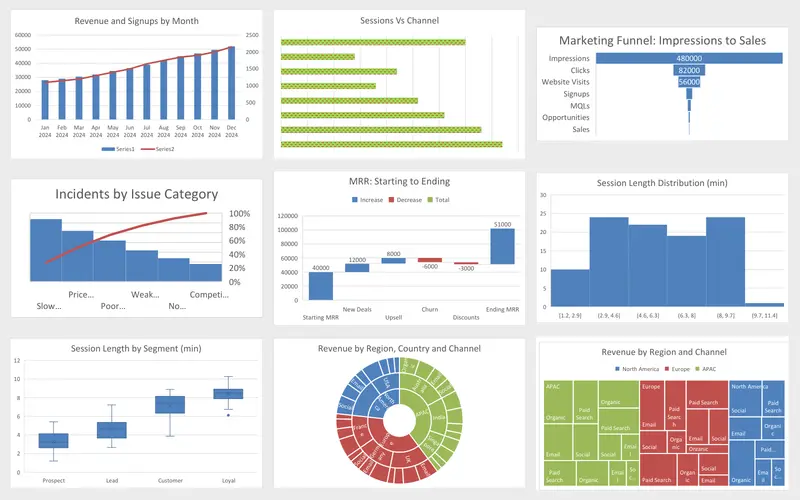
  • Nine Excel chart types from the Marketing Engagement Dashboard: combo, bar, funnel, Pareto, waterfall, histogram, box and whisker, sunburst and treemap.

    Project 04

    Marketing Engagement Dashboard

    Nine charts, each picked for the question it answers.

    Every chart type and when to use it.
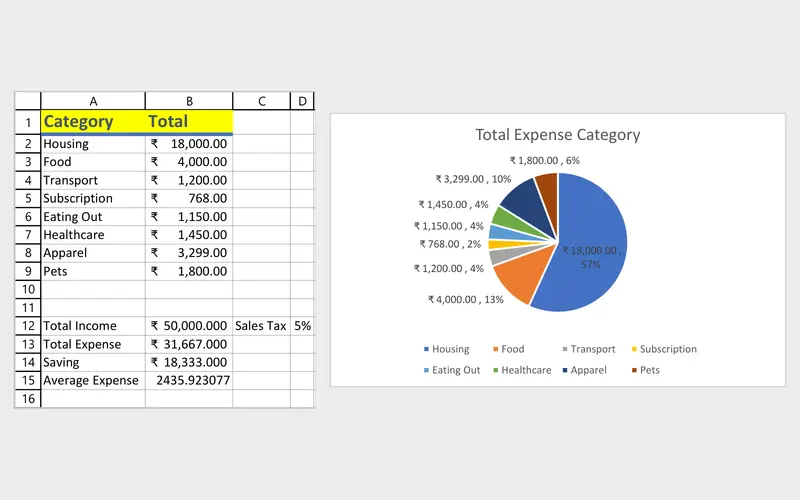
  • Personal budget tracker in Excel: spending by category with income, expense and saving totals beside a pie chart of expenses.

    Project 01

    Personal Budget Tracker

    Your first workbook: where the money goes each month.

    Your first formulas, conditional formatting, charts and a SIP calculator.

  1. 02

    Dunder Michael Paper Company employee database

    Excel Tables, sorting, filtering, data cleaning, text functions and drop-down lists.

  2. 03

    Sales Goal Tracker

    IF, IFS, AND, OR, SUMIF, COUNTIF, SUMIFS, COUNTIFS and date functions.

  3. 07

    TaskFlow

    A project tracker with data validation, conditional formatting, a Gantt-style timeline and sheet protection.

The Complete Excel Course with AI Integration: Sagnik Bhattacharya and Virginia Thorn

Free preview lessons

Watch before you decide.

These lessons are free to watch in full, so you can judge the teaching before you pay anything.

01

Lesson 1

Introduction

2 min

02

Lesson 2

Course overview

What you will learn in this Excel and AI course

5 min

03

Lesson 3

The Excel interface

Ribbon, tabs, name box, formula bar and navigation

13 min

04

Lesson 4

Workbooks and worksheets in Excel

Add, rename, move and navigate sheets

6 min

Curriculum

Every lesson, in order.

17 sections · 186 lessons · 16 hours

01 Microsoft Excel fundamentals: building a foundation from scratch 13 lessons · 1 h 5 min

You start from zero: the Excel window, workbooks and sheets, entering data and formatting numbers and cells. Then you write your first formulas (SUM, AutoSum, percentages and cell references) and fix common errors while building a personal budget.

  1. 1 Introduction Free preview 2 min
  2. 2 Course overview What you will learn in this Excel and AI course Free preview 5 min
  3. 3 The Excel interface Ribbon, tabs, name box, formula bar and navigation Free preview 13 min
  4. 4 Workbooks and worksheets in Excel Add, rename, move and navigate sheets Free preview 6 min
  5. 5 Your first Excel spreadsheet Cells, rows, columns and data types in a budget 8 min
  6. 6 Number formatting in Excel Currency, date and percentage formats for a budget 5 min
  7. 7 Cell formatting in Excel AutoFit column width, the #### error and cell styles 6 min
  8. 8 Basic maths in Excel Add, subtract, multiply and divide with formulas 3 min
  9. 9 SUM and AutoSum in Excel Total income, expenses and savings with MAX 6 min
  10. 10 Relative vs absolute references in Excel Dollar signs and mixed references 3 min
  11. 11 Calculating percentages in Excel Each expense as a percentage of income 2 min
  12. 12 Common Excel errors and how to fix them DIV0, NAME, VALUE errors and IFERROR 4 min
  13. 13 Organising an Excel workbook Dashboard, transactions and notes sheets 2 min
02 Project: personal budget tracker 5 lessons · 29 min

In your first guided project, you turn a personal budget into a working tracker with totals and averages, colour-coded warnings, a monthly summary by category and a pie chart. You finish with a calculator that shows how a monthly investment grows over time.

  1. 14 SUM and AVERAGE in Excel Personal budget tracker totals and average expense 4 min
  2. 15 Conditional formatting in Excel Highlight rules, data bars and icon sets 3 min
  3. 16 Monthly expense summary in Excel Category totals for a personal budget tracker 7 min
  4. 17 Excel charts for beginners Pie chart of budget expenses by category 8 min
  5. 18 SIP growth calculator in Excel FV function for mutual fund investment growth 7 min
03 Managing data in Excel: sort, filter and tables (Dunder Michael Paper employee database) 9 lessons · 1 h 1 min

Using a sample employee database, you keep a long list of records under control with Excel tables, sorting, filtering and data clean-up. You also remove duplicates, split names and columns automatically, keep headers in view while scrolling and print neatly.

  1. 19 Excel tables Create and format a table, structured references and total row 8 min
  2. 20 Sorting data in Excel Single and multi-level sort on an employee database 6 min
  3. 21 Filtering data in Excel AutoFilter, text and number filters on employee data 10 min
  4. 22 Cleaning data in Excel TRIM, Paste Special values and Find and Replace 13 min
  5. 23 Remove duplicates in Excel Find and delete duplicate rows in an employee list 6 min
  6. 24 Flash Fill in Excel Split first and last names automatically 3 min
  7. 25 Text to Columns in Excel Split data by delimiter into separate columns 6 min
  8. 26 Freeze panes in Excel Lock header rows and columns while scrolling 3 min
  9. 27 Printing in Excel Print area, page orientation, scaling and page layout 6 min
04 Essential formulas and functions (IF, SUMIF and more) 13 lessons · 1 h 17 min

You learn the formulas people use every day: IF and its relatives for yes-or-no decisions, and COUNT, SUMIF, COUNTIF and their multi-condition versions for quick summaries. You finish with date and time functions and how to find any function you need.

  1. 28 Logical functions in Excel TRUE and FALSE comparisons for beginners 5 min
  2. 29 The IF function in Excel Pass or fail results with a single condition 3 min
  3. 30 IF function practice in Excel Categorise sales data with IF formulas 6 min
  4. 31 Nested IF and IFS in Excel Customer value tiers with nested IF 6 min
  5. 32 Nested IF and IFS in Excel Sales performance labels with the IFS function 5 min
  6. 33 AND and OR with IF in Excel Flag high-value deals with multiple conditions 8 min
  7. 34 SUM, COUNT and COUNTA in Excel SUM with FILTER and counting numbers with COUNT 7 min
  8. 35 SUM, COUNT and COUNTA in Excel COUNTA, unique counts and completeness checks 4 min
  9. 36 SUMIF and COUNTIF in Excel Conditional sum and count with one criterion 8 min
  10. 37 SUMIFS and COUNTIFS in Excel Sum and count with multiple criteria 7 min
  11. 38 The Excel function library Insert Function dialog and Formula AutoComplete 5 min
  12. 39 Date and time functions in Excel TODAY, NOW, MONTH and date arithmetic 6 min
  13. 40 Excel Ninja Challenge COUNTIF, SUMIF, IF, COUNTIFS, SUMIFS and IFS practice 8 min
05 Text functions and data validation (enhancing data quality) 7 lessons · 35 min

You combine and clean text with functions such as CONCAT, TEXTJOIN, TRIM, PROPER and SUBSTITUTE, and stop bad data at the source with drop-down lists. You finish with a Ninja Challenge on a messy employee list.

  1. 41 CONCAT, the & operator and TEXTJOIN in Excel Combine text from multiple cells 6 min
  2. 42 TRIM, UPPER, LOWER and PROPER in Excel Clean messy text and fix capitalisation 6 min
  3. 43 FIND, SEARCH and SUBSTITUTE in Excel Locate and replace text with formulas 5 min
  4. 44 Text to Columns wizard in Excel Split a column by a comma delimiter 4 min
  5. 45 Data validation in Excel Create drop-down lists for consistent data entry 4 min
  6. 46 Ninja Challenge: problem Clean messy data with text functions and validation 4 min
  7. 47 Ninja Challenge: solution PROPER, Text to Columns and drop-down lists 7 min
06 Data visualisation: charts and graphs 9 lessons · 45 min

You choose the right chart and build it well: column, line, pie and combo charts, clean formatting and sparklines (tiny charts inside cells). You also use Excel's modern business charts, such as funnel, Pareto, waterfall, histogram and treemap.

  1. 48 Choosing the right Excel chart Column, line, pie, combo and modern chart types 4 min
  2. 49 Column charts in Excel Insert, format and label a column chart 5 min
  3. 50 Line charts in Excel Show trends over time with a line chart 4 min
  4. 51 Pie charts in Excel Show proportions and parts of a whole 4 min
  5. 52 Combo charts in Excel Column and line chart with a secondary axis 4 min
  6. 53 Formatting charts in Excel Titles, data labels, colours and chart styles 7 min
  7. 54 Sparklines in Excel Line, column and win-loss mini charts in cells 5 min
  8. 55 Funnel, Pareto and waterfall charts in Excel Modern charts for business data 5 min
  9. 56 Histogram, box and whisker, treemap and sunburst Advanced Excel chart types 6 min
07 PivotTables and PivotCharts: data analysis made easy 10 lessons · 33 min

You summarise thousands of rows with PivotTables: prepare the data, build and arrange the table, group by date, add slicers (clickable filters) and PivotCharts, then style the report and refresh it when the data changes. You finish with a challenge on sales by region, category and month.

  1. 57 PivotTables 101 in Excel What a PivotTable does and the sales dataset 5 min
  2. 58 Preparing data for PivotTables Clean data with TRIM, PROPER, find and replace 5 min
  3. 59 Create your first PivotTable in Excel Insert a PivotTable from a sales table 1 min
  4. 60 PivotTable fields in Excel Rows, values, columns and Value Field Settings 2 min
  5. 61 PivotTable summaries in Excel Sales by product category and grouping by date 4 min
  6. 62 Slicers in Excel Filter PivotTables with clickable buttons 3 min
  7. 63 PivotCharts in Excel Create interactive charts from a PivotTable 5 min
  8. 64 PivotTable design Tab Report layouts, PivotTable styles and number formats 5 min
  9. 65 Refresh a PivotTable in Excel Update pivots when source data changes 2 min
  10. 66 Excel Ninja Challenge PivotTable sales by region, category and monthly trend 1 min
08 Advanced Excel functions: lookups, text and arrays 12 lessons · 54 min

Working with an HR dataset, you look up data with VLOOKUP, XLOOKUP, INDEX and MATCH, handle errors, combine and split text, and calculate working days. You then use the dynamic array functions UNIQUE, FILTER, SORT and SORTBY, and finish with a lookup challenge.

  1. 67 Lookup functions in Excel The PeopleInsight HR dataset and why lookups matter 2 min
  2. 68 VLOOKUP in Excel Find employee data across sheets with exact match 4 min
  3. 69 XLOOKUP in Excel Exact match, if not found and two-way lookup 6 min
  4. 70 IFERROR in Excel Handle lookup errors in VLOOKUP and XLOOKUP formulas 3 min
  5. 71 INDEX and MATCH in Excel A flexible alternative to VLOOKUP 6 min
  6. 72 CONCAT and TEXTJOIN in Excel Combine employee names and text with a delimiter 3 min
  7. 73 LEFT, RIGHT and MID in Excel Extract parts of a text code like DAL-SAL-0001 7 min
  8. 74 TODAY, EOMONTH and NETWORKDAYS in Excel Date calculations for HR data 5 min
  9. 75 UNIQUE function in Excel Extract a distinct list with dynamic arrays 6 min
  10. 76 FILTER function in Excel Dynamic array filtering with AND and OR criteria 5 min
  11. 77 SORT and SORTBY in Excel Sort data dynamically with formulas 4 min
  12. 78 Excel Ninja Challenge XLOOKUP, totals and text concatenation lookup challenge 3 min
09 Project: task automation with data validation and forms 9 lessons · 49 min

You build TaskFlow, a task tracker with drop-down lists for status and priority, highlighting for overdue work, a Gantt chart timeline and a count of the days left to each deadline. Then you protect the sheet against accidental edits and test it with sample data.

  1. 79 TaskFlow project tracker in Excel Overview of the task tracker dashboard 4 min
  2. 80 Designing a task tracker in Excel TaskFlow layout, columns and headers 5 min
  3. 81 Data validation in Excel Status and priority drop-down lists in TaskFlow 8 min
  4. 82 Conditional formatting in Excel Highlight overdue and completed tasks 8 min
  5. 83 Gantt chart in Excel Build a project timeline with conditional formatting 6 min
  6. 84 Data bars and icon sets in Excel Visual priority and progress in TaskFlow 6 min
  7. 85 NETWORKDAYS and TODAY in Excel Days remaining and task deadlines in TaskFlow 5 min
  8. 86 Protect a sheet and lock cells in Excel Secure the TaskFlow tracker workbook 4 min
  9. 87 Testing an Excel task tracker Stress test TaskFlow with sample data 3 min
10 Boosting productivity with AI in Excel (Copilot, ChatGPT and Claude) 17 lessons · 1 h 20 min

You get practical work out of AI assistants in Excel: prepare your data, write clear prompts and have Copilot, ChatGPT and Claude produce summaries, PivotTables, charts, formulas and a mini dashboard, checking the output at every step. You also try the COPILOT function and Microsoft's newer agent that builds workbooks.

  1. 88 AI in Excel What Copilot, ChatGPT and Claude can and cannot do 8 min
  2. 89 Prepare data for Copilot in Excel Tables, headers and clean structure 6 min
  3. 90 Copilot executive summary in Excel Summarise a dataset in seconds with AI 5 min
  4. 91 Copilot prompts for Excel Weak vs strong prompts and the PRO prompt pattern 5 min
  5. 92 PivotTables with Copilot Build an Excel PivotTable from a prompt 5 min
  6. 93 Charts with Copilot and ChatGPT Create and choose the right Excel chart 6 min
  7. 94 Conditional formatting with Copilot and ChatGPT Highlight problems in Excel 4 min
  8. 95 Excel formulas with AI Copilot and ChatGPT write formula columns you verify 6 min
  9. 96 Find outliers with Copilot in Excel Discounts, negative profit, suspect rows 7 min
  10. 97 Clean messy data with Copilot in Excel AI prompts plus Excel functions 4 min
  11. 98 Mini dashboard with Copilot in Excel KPIs, charts and slicers on one page 3 min
  12. 99 Check AI output in Excel A quick QA checklist for Copilot results 2 min
  13. 100 ChatGPT as your analysis planner Plan an Excel analysis before you build it 3 min
  14. 101 COPILOT function in Excel Use Copilot as a formula inside your cells 4 min
  15. 102 Copilot guided help in Excel Step-by-step AI help inside Excel 3 min
  16. 103 Microsoft Stride for Excel The Office Agent that builds workbooks for you 4 min
  17. 104 Claude in Excel Analyse data and build spreadsheets with Claude 7 min
11 MarketPulse campaign intelligence dashboard 10 lessons · 50 min

In this marketing project, you clean campaign data, plan the key numbers with ChatGPT and Copilot, and calculate click-through rate, conversion rate and return on investment. You then build an interactive dashboard with PivotTables, charts, KPI cards (headline-number tiles), slicers and a timeline.

  1. 105 MarketPulse marketing dashboard in Excel Project overview and campaign data 4 min
  2. 106 Clean and check marketing data in Excel Remove duplicates, Copilot KPI plan 4 min
  3. 107 Plan a marketing dashboard with ChatGPT KPIs and the PivotTable strategy 4 min
  4. 108 Marketing PivotTables in Excel Build the MarketPulse pivot back end 6 min
  5. 109 CTR, conversion rate and ROI in Excel Marketing KPI formulas with IFERROR 4 min
  6. 110 PivotTables with Copilot Generate and verify marketing pivots in Excel 6 min
  7. 111 Marketing charts and a timeline in Excel MarketPulse dashboard PivotCharts 4 min
  8. 112 KPI cards in Excel Marketing KPI cards for the MarketPulse dashboard 7 min
  9. 113 Slicers for an Excel dashboard Interactive filtering in MarketPulse 4 min
  10. 114 Polish an Excel marketing dashboard Final formatting and insights in MarketPulse 9 min
12 Project: FinanceGuard budget variance analyser (budget vs actual Excel dashboard) 10 lessons · 52 min

In this finance project, you compare budget with actual spending, building the model with modern formulas. You then add variance calculations, colour-coded number formats, PivotTables, KPI cards, a combo chart and slicers to make a dashboard that shows where the money went.

  1. 115 FinanceGuard budget vs actual dashboard Excel project overview 3 min
  2. 116 Excel tables for budget and actual data Organise the FinanceGuard datasets 4 min
  3. 117 Budget vs actual model in Excel SORT, UNIQUE, VSTACK, LET, TEXTSPLIT, SUMIFS 8 min
  4. 118 Budget variance in Excel Calculate variance and percent variance 4 min
  5. 119 Custom number formats in Excel Show budget variances with colours and signs 2 min
  6. 120 PivotTables for budget vs actual The FinanceGuard pivot workspace 8 min
  7. 121 KPI cards in Excel Summary cards for a budget variance dashboard 4 min
  8. 122 Budget vs actual charts in Excel Combo chart with secondary axis for variance 5 min
  9. 123 Slicers and PivotCharts in Excel Interactive FinanceGuard budget dashboard 4 min
  10. 124 Finish the FinanceGuard dashboard in Excel Final polish and variance insights 10 min
13 WealthFlow investment and retirement simulator 11 lessons · 1 h 5 min

In this personal-finance project, you model monthly investing (including plans that step up each year), retirement withdrawals and the effect of inflation with FV, XIRR and IF formulas. You then test the plan against tougher scenarios and build a retirement simulator dashboard with Claude's help.

  1. 125 SIP and SWP calculators What is an SIP, lump sum and compounding 6 min
  2. 126 SIP and SWP calculators What is an SWP, inflation and FIRE 6 min
  3. 127 WealthFlow SIP model in Excel Input assumptions, XIRR and monthly rate 6 min
  4. 128 WealthFlow SIP model in Excel Step-up SIP table and FV formulas 6 min
  5. 129 WealthFlow SIP model in Excel Real portfolio value, inflation and charts 7 min
  6. 130 WealthFlow SWP model in Excel Real rate, corpus and yearly withdrawals 6 min
  7. 131 WealthFlow SWP model in Excel Real corpus, stress test and SWP chart 5 min
  8. 132 Retirement simulator in Excel WealthFlow inputs, year and age columns 5 min
  9. 133 Retirement simulator in Excel SIP, withdrawal and portfolio formulas with IF 7 min
  10. 134 Retirement simulator in Excel Reading the results and retirement scenarios 5 min
  11. 135 Retirement simulator in Excel Claude builds the WealthFlow dashboard 5 min
14 VBA and macros in Excel: FormatWizard 17 lessons · 1 h 16 min

You automate repetitive work by recording macros, running them from a button and saving macro-enabled workbooks. Then you write your own VBA code with variables, If statements and loops to check a sales sheet, highlight problems and handle errors.

  1. 136 Excel macros and VBA for beginners What macros are, the FormatWizard project 3 min
  2. 137 Record your first Excel macro Name, run and use absolute references 6 min
  3. 138 Relative references in Excel macros Make recorded macros dynamic 4 min
  4. 139 Developer Tab in Excel Run macros from a button and the quick access toolbar 4 min
  5. 140 Save macros in Excel Macro-enabled workbooks and the XLSM file format 3 min
  6. 141 The VBA Editor in Excel Open it with Alt+F11 and learn the workspace 4 min
  7. 142 Working in the VBA editor Macro security, trust settings, switching to Excel 6 min
  8. 143 Your first VBA code Modules, worksheets, rows, columns and formatting 4 min
  9. 144 VBA variables and data types Sub vs function for Excel beginners 6 min
  10. 145 VBA functions in Excel Build GetLastUsedRow with find and exit function 5 min
  11. 146 Clear old flags with VBA Reset messages and fill colours with if statements 5 min
  12. 147 For Next loop in VBA Flag missing region values in Excel 4 min
  13. 148 VBA If Else and loops Check missing sales data and build a FlagText message 5 min
  14. 149 Highlight cells with VBA Interior.Color and RGB for missing data 5 min
  15. 150 IsNumeric in VBA Validate unit price and amount data types in Excel 7 min
  16. 151 Debugging VBA for beginners Debug.Print and the Immediate window 5 min
  17. 152 Complete Excel validation macro One VBA subroutine with an error handler 3 min
15 SalesFusion: advanced data tools and a Power Query modelling system 21 lessons · 2 h 7 min

With Power Query, you turn messy data from many CSV files into one clean model: clean columns and text, fix data types, merge and stack tables, combine a whole folder of files at once and reshape wide tables. You then build a Power Pivot data model with relationships and DAX measures (Power Pivot's formula language) to feed PivotTable reports and an interactive dashboard.

  1. 153 SalesFusion Power Query project Excel ETL pipeline and data model overview 5 min
  2. 154 Introduction to Power Query in Excel The ETL workflow explained 5 min
  3. 155 Import a CSV with Power Query Get data from text and transform data 2 min
  4. 156 Clean columns in Power Query Remove and rename columns for modelling 5 min
  5. 157 Clean text in Power Query Trim, clean, replace values and fix text case 6 min
  6. 158 Data types in Power Query Fix date, whole number, decimal and text types 7 min
  7. 159 Date columns in Power Query Add year, month and year-month fields for reports 7 min
  8. 160 Business logic in Power Query Custom and conditional columns for profitability 6 min
  9. 161 Group By in Power Query Summarise sales by month and region to validate data 5 min
  10. 162 Close and Load in Power Query Connection only, table or Data Model 5 min
  11. 163 Merge queries in Power Query Look up product and region names with a left join 5 min
  12. 164 Reuse a Power Query pipeline Duplicate queries for a new year of sales data 5 min
  13. 165 Append queries in Power Query Combine 2024 and 2025 sales tables 3 min
  14. 166 From Folder in Power Query Combine every sales file in a folder automatically 9 min
  15. 167 From Folder automation in Power Query Profit metrics and fiscal year columns 7 min
  16. 168 Build a sales fact table in Power Query Merge lookups and append history 6 min
  17. 169 Power Pivot Data Model in Excel Relationships and Diagram View 6 min
  18. 170 DAX measures in Power Pivot Total sales, margin percent and percent of total 10 min
  19. 171 PivotTable report from the Data Model Format the SalesFusion report in Excel 5 min
  20. 172 Interactive Excel dashboard Data model PivotTables, slicers and styling 10 min
  21. 173 Unpivot columns in Power Query Turn wide month columns into a long table 8 min
16 Power Automate: weekly sales report automation 12 lessons · 53 min

You automate Excel chores with Power Automate Desktop: build your first flow, connect it to Excel, read worksheet data, start from templates or the recorder, and add conditions, approvals and loops. You also run a flow from a desktop shortcut or a link.

  1. 174 Power Automate Desktop for Excel Set up AutoFlow and your first automation 3 min
  2. 175 Your first Power Automate flow Flows, triggers, actions and Display message 3 min
  3. 176 Connect Excel to Power Automate Launch Excel and the Excel instance variable 3 min
  4. 177 Copilot Vision with Power Automate AI-guided help while you build a flow 2 min
  5. 178 Read data from Excel with Power Automate Read from worksheet and close Excel 4 min
  6. 179 Power Automate templates Search and replace Excel values template walkthrough 7 min
  7. 180 Run Power Automate flows From a desktop shortcut and a run URL 3 min
  8. 181 Power Automate Desktop recorder Record desktop and browser actions into a flow 4 min
  9. 182 Action properties in Power Automate UI elements, variables and wait settings 4 min
  10. 183 Approval flow in Power Automate Desktop If conditions and message box buttons 9 min
  11. 184 Loops in Power Automate Desktop Loop and For each actions for Excel rows 5 min
  12. 185 Power Automate Ninja Challenge Flag onboarded rows with loop, read, if, write 5 min
17 Wrap-up 1 lessons · 1 min

A closing lesson recaps what you have learnt across the course.

  1. 186 Course wrap-up Next steps after the course 1 min

Ready to start building?

Regular price $129 now $79 · Lifetime access · 14-day money-back guarantee

Instructors

Who teaches it.

Virginia Thorn smiling at the camera, dark hair tied back, wearing a navy top.

Instructor, Excel with AI

Virginia Thorn

Emmy Award winner. Teaches Excel with AI at Coding Liquids.

Requirements

  • Microsoft Excel on Windows or Mac. The Power Pivot and Power Automate sections need Windows.
  • No Excel experience needed. The course starts from your very first spreadsheet.

Who it is for

  • Beginners who want to learn Excel by building real projects.
  • Financial analysts and accountants who build budget vs actual reports.
  • HR teams who manage employee data.
  • Sales teams who track targets and sales reports.
  • Marketing teams who track campaigns, CTR, conversion and ROI.
  • Operations and project teams who run trackers and schedules.
  • Data analysts who want Power Query, data modelling and DAX in Excel.
The course by job, level or topic

The Complete Excel Course with AI Integration is an online video course from Coding Liquids: 16 hours of video in 186 lessons, built around 14 projects. Build the Excel workbooks companies actually run on: budget vs actual dashboards, clean HR data, Power Query and DAX models, macros and VBA, and AI with Copilot, ChatGPT and Claude. Hands-on from the first lesson, taught by Sagnik Bhattacharya and Emmy Award winner Virginia Thorn. Free preview lessons. Every purchase includes lifetime access, a Certificate of Completion with a verification link and a 14-day money-back guarantee.

What this course is

Most Excel courses teach you buttons. This one makes you build the workbooks companies actually run on: a budget vs actual dashboard that explains the gap, an HR database joined across sheets, a sales report that refreshes in one click, a Power Query pipeline with a data model and DAX measures, macros that check a whole sheet for you, and Copilot, ChatGPT and Claude doing the heavy lifting while you stay in control.

Hands-on from the first lesson. You open the starter workbook, build along with us step by step, and finish every section with a workbook you made yourself. Nothing here is a feature tour. Every function, chart and tool is learned because the project in front of you needs it.

Skills recruiters search for

VLOOKUP, XLOOKUP, INDEX MATCH, SUMIFS, COUNTIFS, PivotTables, slicers, dashboards, data cleaning, Power Query, ETL, Power Pivot, data modelling, DAX, dynamic arrays, macros, VBA, Power Automate, Copilot in Excel. You do not memorise them. You use each one to finish a project, which is how they stick.

How it is taught

  • Short lessons, one skill each, recorded in the latest version of Excel.
  • Starter and complete workbooks for every project.
  • Ninja Challenges to solve on your own, and section quizzes to check what stuck.
  • Captions on every lesson.

None of the instructors’ voices are AI-generated. Every lesson is recorded and taught by Sagnik Bhattacharya and Virginia Thorn themselves.

Your first project starts in lesson one.

What you get

Everything a course should come with.

  • Lifetime access

    Come back to any lesson whenever you need it, with future updates included.

  • Certificate of Completion

    A PDF certificate with a verification link, emailed when you finish.

  • Projects you keep

    Every section ends with something you built: a dashboard, an app screen, an automation.

  • Instructor support plan

    Two months of questions answered by the instructor, plus Ask AI in every lesson for immediate answers drawn from that lesson, labelled as AI. Activate it whenever you choose.

  • Team plans

    Several seats at a per-seat discount, with a team area to follow progress.

Questions

Frequently asked.

Is this course suitable for complete beginners?

Yes. Section 1 starts with the Excel interface and your first spreadsheet, and every later section builds on the one before it. Experienced users can start from the section they need.

I already use Excel at work. Is there enough advanced material?

Yes. Most of the course is past the basics: lookups and dynamic arrays such as XLOOKUP, FILTER, UNIQUE and LET, dashboards with PivotTables and slicers, a budget vs actual model, Power Query with a data model and DAX, macros and VBA, Power Automate Desktop, and AI with Copilot, ChatGPT and Claude. Start from the section you need.

How is this different from free YouTube tutorials?

A tutorial shows one feature. This course is one path from your first spreadsheet to finished workbooks: every lesson builds on the one before, each project comes with a starter and a finished file, section quizzes check what stuck, and you finish with a Certificate of Completion. With the instructor support plan, your questions are answered by the instructor.

Is this a good Excel course for finance, HR, sales or marketing work?

Yes. The projects are the reports those teams build: a budget vs actual dashboard for finance, an employee database and an HR workbook with lookups, a sales goal tracker and a sales performance report with PivotTables, and a marketing dashboard with CTR, conversion rate and ROI.

Which version of Excel do I need?

The course is recorded in the latest version of Excel, Microsoft 365, on Windows or Mac. Most lessons also work in older versions, and the few functions that need a newer one are pointed out when they appear. The Power Pivot and Power Automate sections need Windows.

Do I need Microsoft Copilot?

No. The AI section shows Copilot, ChatGPT and Claude side by side. A free ChatGPT or Claude account covers the lessons; Copilot is optional and needs its own Microsoft licence.

Which Excel course teaches Copilot, ChatGPT and Claude?

The Complete Excel Course with AI Integration does. Its AI section shows Copilot, ChatGPT and Claude on the same tasks: formulas, PivotTables, charts, cleaning data and analysis, with a checklist for checking an AI answer before you rely on it. Later projects use them again, and in one lesson Claude builds a dashboard.

Can I learn Power Query, DAX and VBA in one course?

Yes. The SalesFusion project covers Power Query, a Power Pivot data model and DAX measures. The FormatWizard project covers recorded macros and VBA, and AutoFlow adds Power Automate Desktop. All of it is in this one course, after the formulas, charts and PivotTables it builds on.

How long do I have access?

Lifetime access. You can come back to any lesson whenever you need it, on any device, and future updates to the course are included.

Do I get a certificate?

Yes. A Certificate of Completion is issued as a PDF and emailed to you, with a verification link you can share on LinkedIn or with an employer.

What is the difference between the two options?

Both include the full course. The option with instructor support adds two months of questions answered by the instructor through the inbox under each lesson, plus Ask AI in every lesson for those two months. The two months start on the day you switch them on, not the day you buy, so you can begin whenever you are ready.

Can I ask questions if I get stuck?

With the instructor support plan, every lesson has an Ask AI button that answers immediately from that lesson's material, and you can send any question to the instructor through the inbox under the lesson.

Are the practice files included?

Yes. Every project comes with a starter file and a finished file inside the course, so you build along step by step and can compare your result.

Is the course in English?

Yes, taught in English with English captions. Audio in Hindi, Bengali, Spanish and German is planned, and one purchase will include every language.

What if it is not for me?

There is a 14-day money-back guarantee. Details are in the refund policy.

Can I buy it for a team?

Yes. Team plans give several seats at a per-seat discount, with a team area to add people and follow their progress.

Ready?

Start Excel with AI today.

Regular price $129 now $79 for lifetime access, or Regular price $180 now $120 with two months of instructor support and Ask AI, started whenever you choose. 14-day money-back guarantee.

Questions first? Contact us or chat on WhatsApp.